geo_gene_exp_download.r GEO数据自动下载与整理
geo_download.r GEO数据下载
使用方法:
$Rscript /share/work/huangls/piplines/omicsclass/tcga_geo/scripts/geo_gene_exp_download.r  -h
usage: /share/work/huangls/piplines/omicsclass/tcga_geo/scripts/geo_gene_exp_download.r
       [-h] -g gse [-f func] [-p palette] [-G gpl] [-s Gene Symbol] [-x]
       [--log2] [-o outdir] [-H height] [-W width]
download GEO data ; https://www.omicsclass.com/article/1492
optional arguments:
  -h, --help            show this help message and exit
  -g gse, --gse gse     GEO Series Accession [required]
  -f func, --func func  dup gene name expression select func: mean max median
                        [default max]
  -p palette, --palette palette
                        A palette name from RColorbrewer [default Accent]
  -G gpl, --gpl gpl     GPL file for annotation [default None]
  -s Gene Symbol, --symbol Gene Symbol
                        Gene Symbol column name [default Gene Symbol]
  -x, --no.xaxis        not show x axis sample name [default False]
  --log2                whether do log2 normalize [optional, default: False]
  -o outdir, --outdir outdir
                        output file directory [default /share/nas1/huangls/pro
                        ject/zx-20210914-383-gwas_cfdr/gene_exp]
  -H height, --height height
                        the height of pic inches [default 8]
  -W width, --width width
                        the width of pic inches [default 10]
使用举例:
Rscript /share/work/huangls/piplines/omicsclass/tcga_geo/scripts/geo_gene_exp_download.r  -g GSE7429
Rscript /share/work/huangls/piplines/omicsclass/tcga_geo/scripts/geo_gene_exp_download.r -g GSE43488 -G GPL13667-15572.txt
结果输出:

数据整理说明
探针与基因对应:
1.一个基因对应多个探针: 取均值,最大值,等
2.一个探针多个基因,取第一个基因名字
表达量是否需要重新标准化:
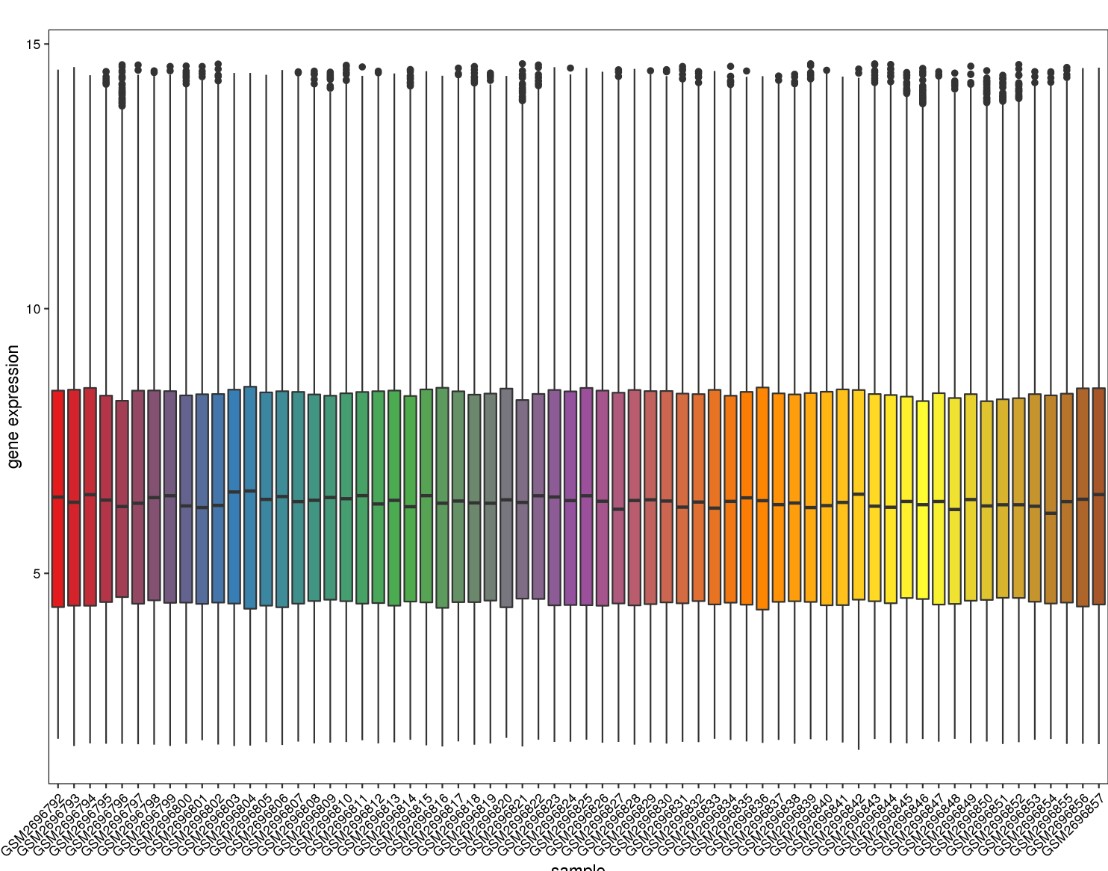
可以通过boxplot函数观察一下样本表达丰度值的分布是否整齐进行判断
是否需要log2:根据数据值的大小:
如果表达丰度的数值在50以内,通常是经过log2转化的。如果数字在几百几千,则是未经转化的。
使用过程中常见问题:
1. 如果中通下载中断 可以用wget -c 下载完成之后再运行该命令:
 wget -c 继续下载

可以自己下载GPL文件, GPL 文件应去掉含有#号的行,第一列必须是探针ID,里面必须有 "Gene Symbol" (注意大小写)列不同的基因用 /// 分割:
示例:
Rscript $scripts/geo_gene_exp_download.r -g GSE20680 -o GSE20680 --skip 28
Rscript $scripts/geo_gene_exp_download.r -g GSE20681 -o GSE20681 --skip 28
- 发表于 2021-06-18 17:06
- 阅读 ( 3103 )
- 分类:GEO
你可能感兴趣的文章
- 用AI写代码批量整理GEO数据库中的单细胞数据 363 浏览
- 单细胞转录组数据挖掘流程记录-头颈癌(HNSCC)(GSE181919) 878 浏览
- 细胞焦亡、铁死亡及铜死亡等基因集 3881 浏览
- 记录一个数据下载:GSE12417 1381 浏览
- 生信挖掘GEO+TCGA 文献速览 1899 浏览
- IF=3.47|非肿瘤-眼部老年黄斑变性ceRNA文章思路 2613 浏览
相关问题
- 代码报错 2 回答
- 老师您好,我这个是双通道芯片,我把read.maimages的所有source都试了一遍,还是不能把原始文件读进来 1 回答
- 老师您好,我在进行GEO分析时,打开分组文件group_file时出现报错,请问我该如何解决? 1 回答
- 请问老师,GEO数据分析时,运行gset = getGEO(GSE, GSEMatrix =TRUE, AnnotGPL=FALSE,destdir=workdir)时,遇到如图中报错,该如何处理呢? 1 回答
- Error in (function (classes, fdef, mtable) : unable to find an inherited method for function ‘bg.correct’ for signature ‘"HTAFeatureSet", "character"’ 0 回答
- 安捷伦双色通道 “RawData=read.maimages(files=files,source="genepix") “报错” 2 回答
0 条评论
请先 登录 后评论
