cnv_dumbbell_plot.r 绘制哑铃图ggplot2包
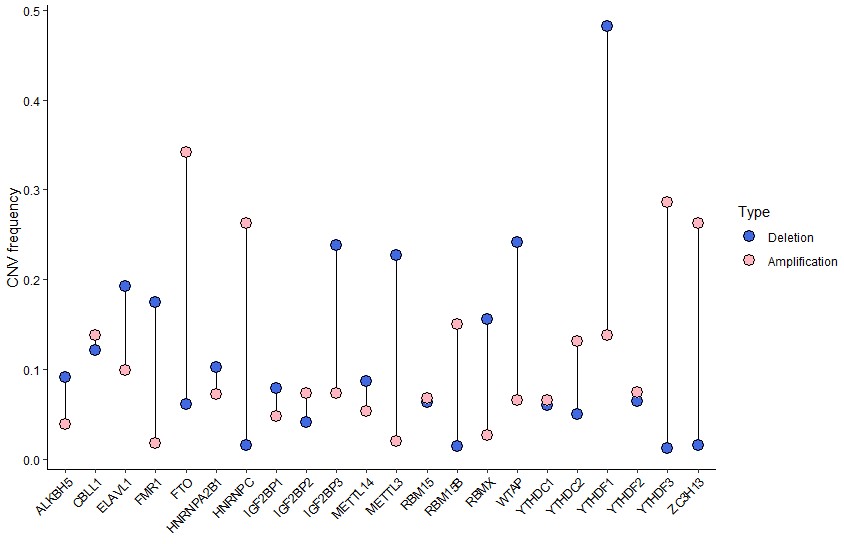
R包ggplot2绘制哑铃图展示基因的CNV突变频率
使用方法:
$Rscript scripts/cnv_dumbbell_plot.r -h
usage: scripts/cnv_dumbbell_plot.r [-h] -c CNV_DATA -g GENE_SYMBOL [-H HEIGHT]
                                   [-W WIDTH] [-o OUTDIR] [-p PREFIX]

CNV_Dumbbell_plot:https://www.omicsclass.com/article/1572

optional arguments:
  -h, --help            show this help message and exit
  -c CNV_DATA, --cnv_data CNV_DATA
                        input cnv data file path[required]
  -g GENE_SYMBOL, --gene_symbol GENE_SYMBOL
                        Enter the file path that contains the gene
                        symbol[required]
  -H HEIGHT, --height HEIGHT
                        the height of dumbbell plot[optional,default 6]
  -W WIDTH, --width WIDTH
                        the width of dumbbell plot[optional,default 8]
  -o OUTDIR, --outdir OUTDIR
                        output file directory[optional,default cwd]
  -p PREFIX, --prefix PREFIX
                        out file name prefix[optional,default m6a_cnv]
参数说明:
-c 输入拷贝数变异数据经过GISTIC软件分析过后的结果文件:
| Gene Symbol | Locus ID | Cytoband | TCGA-3Z-A93Z-01A-11D-A36W-01 | TCGA-6D-AA2E-01A-11D-A36W-01 | TCGA-A3-3306-01A-01D-0858-01 | TCGA-A3-3307-01A-01D-0858-01 | TCGA-A3-3308-01A-02D-1322-01 |
| ACAP3 | 116983 | 1p36.33 | -0.001 | 0.002 | 0.009 | 0.015 | 0.005 |
| ACTRT2 | 140625 | 1p36.32 | -0.001 | 0.002 | 0.009 | 0.015 | 0.005 |
-g 输入用于绘制哑铃图的基因文件:
| ID | group |
| RBM15 | W |
| RBM15B | W |
| METTL14 | W |
-H和-W 指定生成图片的高和宽,默认高为6,宽为8
使用举例:
Rscript ../scripts/cnv_dumbbell_plot.r -g ../m6a.tsv \
    -c ../01.TCGA_data/TP_CNV_Gistic2_Level_4/all_data_by_genes.txt
结果展示:

- 发表于 2021-10-15 15:38
- 阅读 ( 2701 )
- 分类:R
你可能感兴趣的文章
- 不均等坐标系绘制 510 浏览
- ggplot 柱状图,y轴从0 开始,最高柱子 留有余地代码: 1995 浏览
- 绘制展示基因在样本中表达量与数量的柱状图 4013 浏览
- ggplot中用字符窜传递变量名称列名等 2435 浏览
- ggplot2中各种主题元素修改对应方法函数速查表 4527 浏览
0 条评论
请先 登录 后评论
