R语言绘制多分组差异分析结果图
R语言绘制多分组差异分析结果图
加载需要的包
2 设置FC和FDR的阈值线
4.3 读入数据
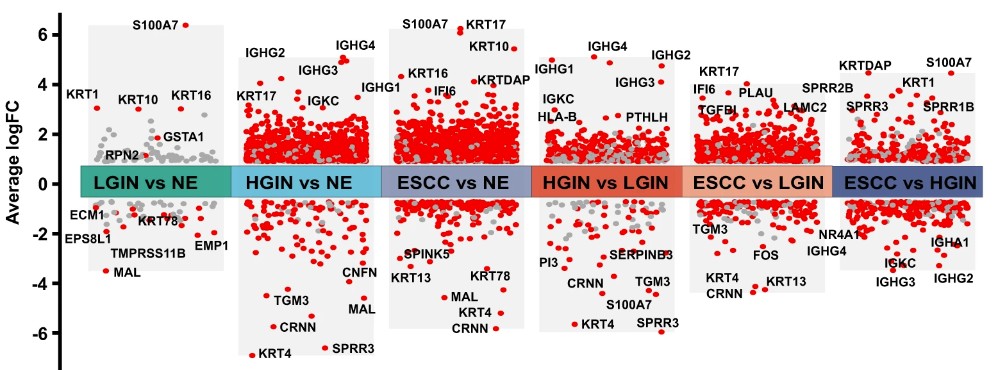
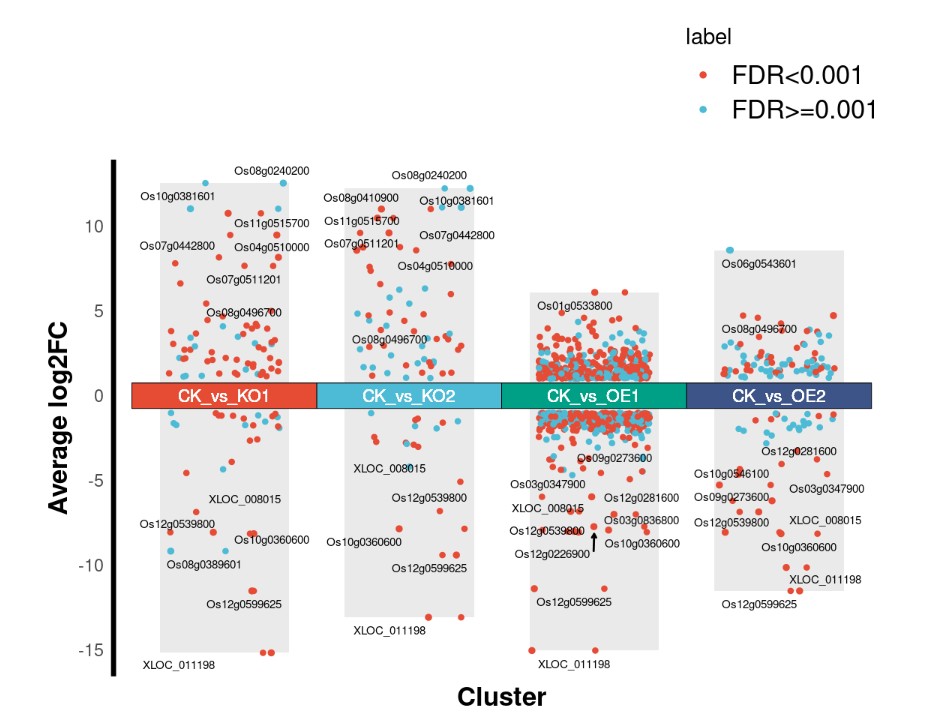
下图是一篇文献中展多分组差异分析的结果图,今天教大家如何使用R语言绘制一张类似的图。

加载需要的包
# 1.安装CRAN来源常用包
#设置镜像,
 local({r <- getOption("repos")
 r["CRAN"] <- "http://mirrors.tuna.tsinghua.edu.cn/CRAN/"
options(repos=r)})

# 依赖包列表:自动加载并安装
package_list <- c("ggplot2","ggnewscale","tidyverse","ggrepel","dplyr","devtools")

# 判断R包加载是否成功来决定是否安装后再加载
for(p in package_list){
  if(!suppressWarnings(suppressMessages(require(p, character.only = TRUE, quietly = TRUE, warn.conflicts = FALSE)))){
    install.packages(p,  warn.conflicts = FALSE)
    suppressWarnings(suppressMessages(library(p, character.only = TRUE, quietly = TRUE, warn.conflicts = FALSE)))
  }
}
2 设置FC和FDR的阈值线
fc_cutoff <- 2
fdr_cutoff <- 0.01
3 读入数据
#设置工作路径
setwd("/share/work/wangq/piplines/class/ref/03.deg")
data<-read.table("Volcano1.txt", header=TRUE,sep = "\t")
head(data)
文件格式如下:
ID    FDR    log2FC    cluster
Os01g0140500    1.281171e-04    -1.028091    CK_vs_KO1
Os01g0141700    9.160378e-11    1.914777    CK_vs_KO1
Os01g0339500    4.491034e-07    -2.570757    CK_vs_KO1
Os01g0392600    2.846885e-03    1.285495    CK_vs_KO1
Os01g0533900    3.601409e-07    1.708476    CK_vs_KO1
Os01g0537250    3.410239e-09    2.578599    CK_vs_KO1
4 添加上下调信息列-regulated
data <-
  data %>%
  mutate(change = as.factor(ifelse(FDR < fdr_cutoff & abs(log2FC) > log2(fc_cutoff),
                                   ifelse(log2FC > log2(fc_cutoff) ,'Up','Down'),'No change'))) %>%
  filter(change != 'No change') %>%
  select(-change)
head(data)
data$label <- ifelse(data$FDR<0.001,"FDR<0.001","FDR>=0.001")
5 ggplot2绘图
#获取每个火山图中前十个差异基因
TopGene <-
  data %>%
  group_by(cluster) %>%
  distinct(ID, .keep_all = T) %>%
  top_n(10, abs(log2FC))
table(TopGene$cluster)
#背景柱状图数据准备
dbar <-
  data %>%
  group_by(cluster) %>%
  summarise_all(list(min = min, max = max)) %>%
  select(cluster, log2FC_min, log2FC_max, label_min) %>%
  rename(label = label_min)
dbar
绘图
p <- ggplot()+
  geom_col(data = dbar,  # 绘制负向背景柱状图
           mapping = aes(x = cluster,y = log2FC_min),
           fill = "#dcdcdc",alpha = 0.6, width = 0.7) +
  geom_col(data = dbar, # 绘制正向背景柱状图
           mapping = aes(x = cluster,y = log2FC_max),
           fill = "#dcdcdc",alpha = 0.6, width = 0.7) +
  geom_jitter(data = data, # 绘制所有数据点
              aes(x = cluster, y = log2FC, color = label),
              size = 0.85,
              width =0.3) +
  geom_jitter(data = TopGene, # 绘制top10数据点
              aes(x = cluster, y = log2FC, color = label),
              size = 1,
              width =0.35) +
  geom_tile(data = TopGene, # 绘制中心分组标记图
            aes(x = cluster,
                y = 0,
                fill = cluster),
            height=1.5,
            color = "black",
            alpha = 0.6,
            show.legend = F) +
  ggsci::scale_fill_npg() + # 自定义颜色
  ggsci::scale_color_npg() + # 自定义颜色
  geom_text_repel(data = filter(data, ID %in% TopGene$ID),  # 这里的filter很关键,筛选你想要标记的基因
                  aes(x = cluster, y = log2FC, label = ID),
                  size = 2,
                  max.overlaps = getOption("ggrepel.max.overlaps", default = 15),
                  color = 'black',
                  force = 1.2,
                  arrow = arrow(length = unit(0.008, "npc"),
                                type = "open", ends = "last")) +
  labs(x="Cluster", y="Average log2FC") +
  geom_text(data=TopGene, # 绘制中心分组标记图文本注释
            aes(x=cluster,
                y=0,
                label=cluster),
            size = 3,
            color ="white") +
  theme_minimal() +
  theme(axis.title = element_text(size = 13,color = "black",face = "bold"),
        axis.line.y = element_line(color = "black",size = 1.2),
        axis.line.x = element_blank(),
        axis.text.x = element_blank(),
        panel.grid = element_blank(),
        legend.position = "top",
        legend.direction = "vertical",
        legend.justification = c(1,0),
        legend.text = element_text(size = 13))
p
 好了,小编就先给大家介绍到这里。希望对您的科研能有所帮助!祝您工作生活顺心快乐!
参考文献:Liu, X., Zhao, S., Wang, K. et al. Spatial transcriptomics analysis of esophageal squamous precancerous lesions and their progression to esophageal cancer. Nat Commun 14, 4779 (2023).
- 发表于 2024-10-25 13:52
- 阅读 ( 881 )
- 分类:R
你可能感兴趣的文章
- 跟着文献学做图 | 用蛋白质序列做主成分分析(PCA) 4752 浏览
- 使用DNA序列做主成分分析(PCA)——R语言adegenet包 5684 浏览
- R语言基础入门—矩阵介绍 3170 浏览
- R语言基础入门—数组 2494 浏览
- R语言基础入门—数据框 2053 浏览
相关问题
0 条评论
请先 登录 后评论
