ROC 曲线绘制,多个和x轴空白
ROC 曲线绘制:
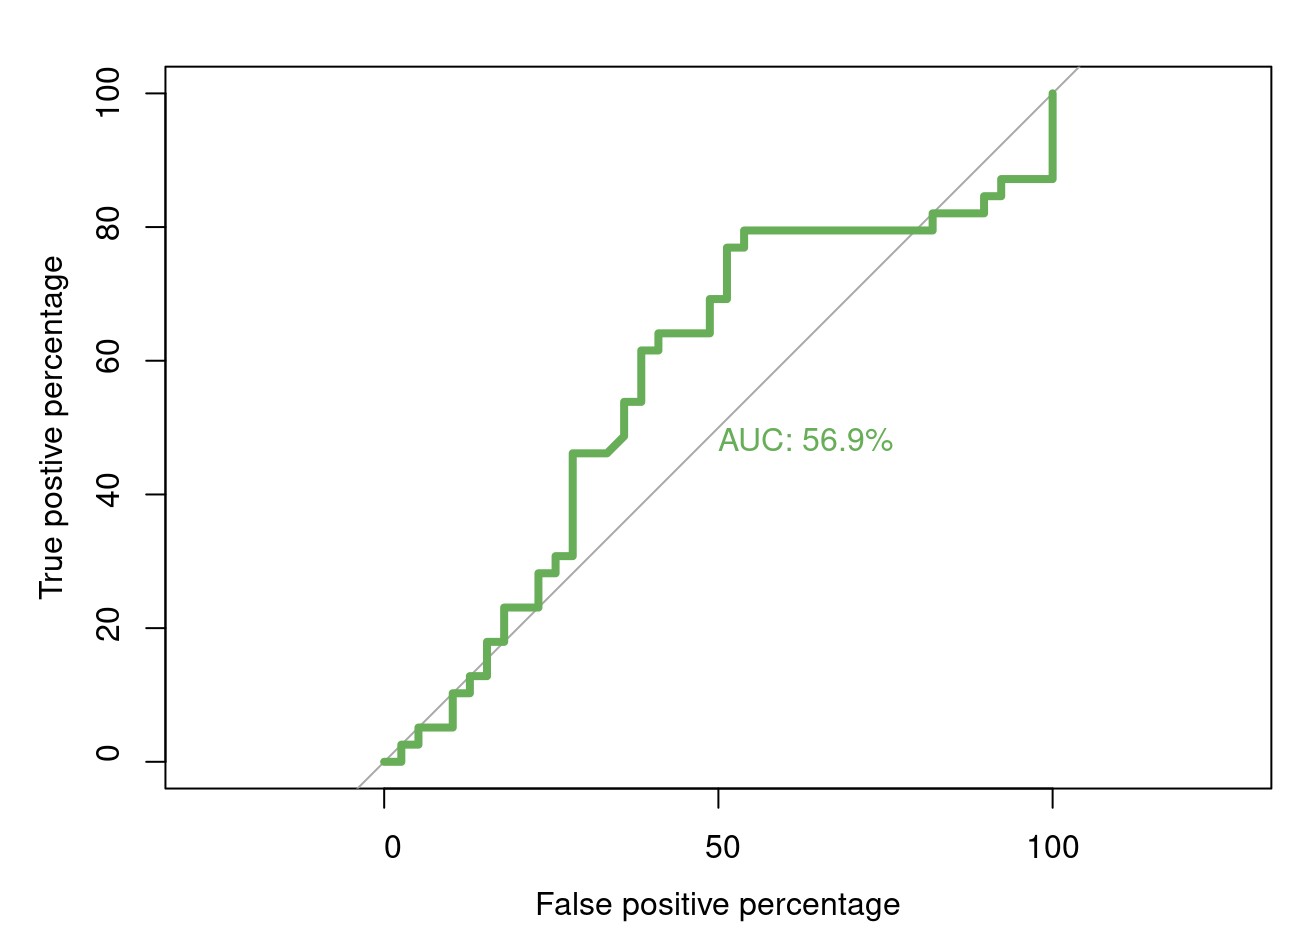
par(pty="s")
roc.info<-roc(testset$group,
    pred1[,1],  #提取随机森林模型中对应的预测指标
    plot=TRUE,
    legacy.axes=TRUE,
    percent=TRUE,
    xlab="False positive percentage",
    ylab="True postive percentage",
    col="#4daf4a",
    lwd=4,
    print.auc=TRUE)
plot.roc(obese,rf.model$votes[,1],percent=TRUE,col="#4daf4a",lwd=4
print.auc=TRUE,add=TRUE,print.auc.y=40)
- 发表于 2025-02-24 20:42
- 阅读 ( 295 )
- 分类:其他
