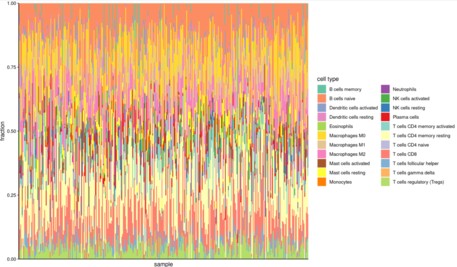
immune_bar_plot.r 免疫侵润分析bar绘图
immune_bar_plot.r 免疫侵润分析bar绘图
使用方法:
$ Rscript  immune_bar_plot.r  -h
usage: immune_bar_plot.r [-h] -i filepath [-t title]
                                                  [-a xlab] [-b ylab]
                                                  [-m metadata]
                                                  [-g group [group ...]] [-x]
                                                  [-o outdir] [-n prefix]
                                                  [-H height] [-W width]
immune bar plot
optional arguments:
  -h, --help            show this help message and exit
  -i filepath, --input filepath
                        input the immune martix [required]
  -t title, --title title
                        input legend tittle name [default cell type]
  -a xlab, --xlab xlab  input xlab [default sample]
  -b ylab, --ylab ylab  input ylab [default fraction]
  -m metadata, --metadata metadata
                        input metadata file [default NULL]
  -g group [group ...], --group group [group ...]
                        name of group order [default NULL]
  -x, --no.xaxis        not show x axis sample name [default False]
  -o outdir, --outdir outdir
                        output file directory [default cwd]
  -n prefix, --name prefix
                        out file name prefix [default demo]
  -H height, --height height
                        the height of pic inches [default 7]
  -W width, --width width
                        the width of pic inches [default 12]
参数说明:
使用举例:
#绘制免疫侵润柱状图
Rscript $scriptdir/immune_bar_plot.r -i immu/cibersort.res.tsv -n cibersort.bar \
-o immu --ylab fraction  --no.xaxis
#按照分组进行排序
Rscript $scriptdir/immune_bar_plot.r -i immu/cibersort.res.tsv -n cibersort.bar.g \
-m metadata.group.tsv -g subtype.hclust -o immu --ylab fraction  --no.xaxis
结果示例:

- 发表于 2021-06-17 13:59
- 阅读 ( 2066 )
- 分类:TCGA
你可能感兴趣的文章
- 胃癌免疫侵润预后Signature数据挖掘-糖酵解 3666 浏览
- 胃癌免疫侵润预后Signature数据挖掘-4.8分SCI思路解析 4994 浏览
- tsne_analysis.r 表达聚类分析 2677 浏览
- immune_box_plot.r 免疫侵润box分布图 2425 浏览
- immune_compare_stat.r 免疫细胞表达差异比较 2024 浏览
0 条评论
请先 登录 后评论
