hclust_analysis.r 转录组数据层次聚类分析
hclust_analysis.r 转录组数据层次聚类分析
使用说明:
usage: hclust_analysis.r [-h] -i filepath [-d distance] [-m method] [-T top]
                         [-S] [-M max.nc] [-k bestk] [-s size] [-a alpha] [-e]
                         [-L] [-X label] [-Y label] [-t label] [-o path]
                         [-H number] [-W number]
Hierarchical Clustering and
plot:https://clincancerres.aacrjournals.org/content/25/16/5002
optional arguments:
  -h, --help            show this help message and exit
  -i filepath, --input filepath
                        input the dataset martix [required]
  -d distance, --distance distance
                        the distance measure to be used to compute the
                        dissimilarity matrix. This must be one of:
                        "euclidean", "maximum", "manhattan", "canberra",
                        "binary", "minkowski" . By default,
                        distance="euclidean".
  -m method, --method method
                        the cluster analysis method to be used. This should be
                        one of: "ward.D", "ward.D2", "single", "complete",
                        "average", "mcquitty", "median", "centroid". by
                        default method=ward.D
  -T top, --top top     select top gene to analysis [default NULL]
  -S, --scale           scale data sd=1 mean=0 [default FALSE]
  -M max.nc, --max.nc max.nc
                        maximal number of clusters for nbclust, between 2 and
                        (number of objects - 1), greater or equal to min.nc.
                        By default [optional, default: 15]
  -k bestk, --bestk bestk
                        set bestk or nbclust choose bestk [optional, default:
                        NULL]

  -X label, --x.lab label
                        the label for x axis [optional, default: sample ]
  -Y label, --y.lab label
                        the label for y axis [optional, default: Distance ]
  -t label, --title label
                        the label for main title [optional, default: Cluster
                        Dendrogram]
  -o path, --outdir path
                        output file directory [default cwd]
  -H number, --height number
                        the height of pic inches [default 5]
  -W number, --width number
                        the width of pic inches [default 10]
使用方法:
应该运行两次
#第一次运行不指定K,通过nbclust 结果选择合适的K (亚型)
Rscript $scriptdir/hclust_analysis.r -i immu/ssgsea.res.tsv  -o hclust  -M 20 --distance "euclidean"
#再次运行指定最佳K,输出聚类树和分组表格
Rscript $scriptdir/hclust_analysis.r -i immu/ssgsea.res.tsv  -o hclust   --distance "euclidean" -k 2
参数说明:
-i 输入基因表达矩阵文件,或者免疫侵润矩阵文件
| cell_type | TCGA-B7-A5TK-01A-12R-A36D-31 | TCGA-BR-7959-01A-11R-2343-13 | TCGA-IN-8462-01A-11R-2343-13 | TCGA-BR-A4CR-01A-11R-A24K-31 | TCGA-CG-4443-01A-01R-1157-13 |
| aDC | 0.612131 | 0.452721 | 0.434065 | 0.352635 | 0.268974 |
| B cells | 0.423323 | 0.40887 | 0.426612 | 0.413857 | 0.289268 |
| Blood vessels | 0.681023 | 0.775439 | 0.689433 | 0.577667 | 0.745019 |
| CD8 T cells | 0.675615 | 0.650073 | 0.629121 | 0.566048 | 0.577315 |
| Cytotoxic cells | 0.621056 | 0.425217 | 0.411617 | 0.3128 | 0.191034 |
| DC | 0.619839 | 0.485056 | 0.489101 | 0.266905 | 0.350132 |
| Eosinophils | 0.502785 | 0.514939 | 0.469541 | 0.488051 | 0.456521 |
| iDC | 0.53162 | 0.498437 | 0.530931 | 0.390699 | 0.420172 |
| Lymph vessels | 0.710843 | 0.721323 | 0.658391 | 0.500574 | 0.400411 |
| Macrophages | 0.608271 | 0.598482 | 0.552277 | 0.468531 | 0.438481 |
| Mast cells | 0.480792 | 0.525927 | 0.47871 | 0.24677 | 0.124795 |
| Neutrophils | 0.447672 | 0.458098 | 0.393541 | 0.3105 | 0.344511 |
| NK CD56bright cells | 0.462633 | 0.418617 | 0.546094 | 0.57262 | 0.460983 |
| NK CD56dim cells | 0.341474 | 0.137147 | 0.031158 | -0.04299 | -0.0389 |
| NK cells | 0.558123 | 0.512929 | 0.507088 | 0.479542 | 0.446198 |
| Normal mucosa | 0.779444 | 0.820281 | 0.806771 | 0.691384 | 0.65646 |
| pDC | 0.676772 | 0.647415 | 0.621186 | 0.482564 | 0.552156 |
| SW480 cancer cells | 0.534151 | 0.600236 | 0.618509 | 0.412196 | 0.60535 |
| T cells | 0.627056 | 0.425422 | 0.399612 | 0.326116 | 0.188205 |
| T helper cells | 0.669103 | 0.645407 | 0.62807 | 0.650216 | 0.628577 |
| Tcm | 0.562408 | 0.559951 | 0.527272 | 0.516068 | 0.553444 |
| Tem | 0.518952 | 0.555942 | 0.410577 | 0.440007 | 0.449251 |
| TFH | 0.485124 | 0.477749 | 0.445061 | 0.465552 | 0.446549 |
| Tgd | 0.190199 | 0.110139 | 0.061648 | 0.004026 | 0.023796 |
| Th1 cells | 0.563928 | 0.491736 | 0.455523 | 0.426351 | 0.378701 |
| Th17 cells | 0.417275 | 0.153713 | 0.218727 | 0.215026 | 0.257282 |
| Th2 cells | 0.536142 | 0.478687 | 0.44716 | 0.539534 | 0.416747 |
| TReg | 0.682036 | 0.484761 | 0.516963 | 0.30884 | 0.312123 |
输出结果:
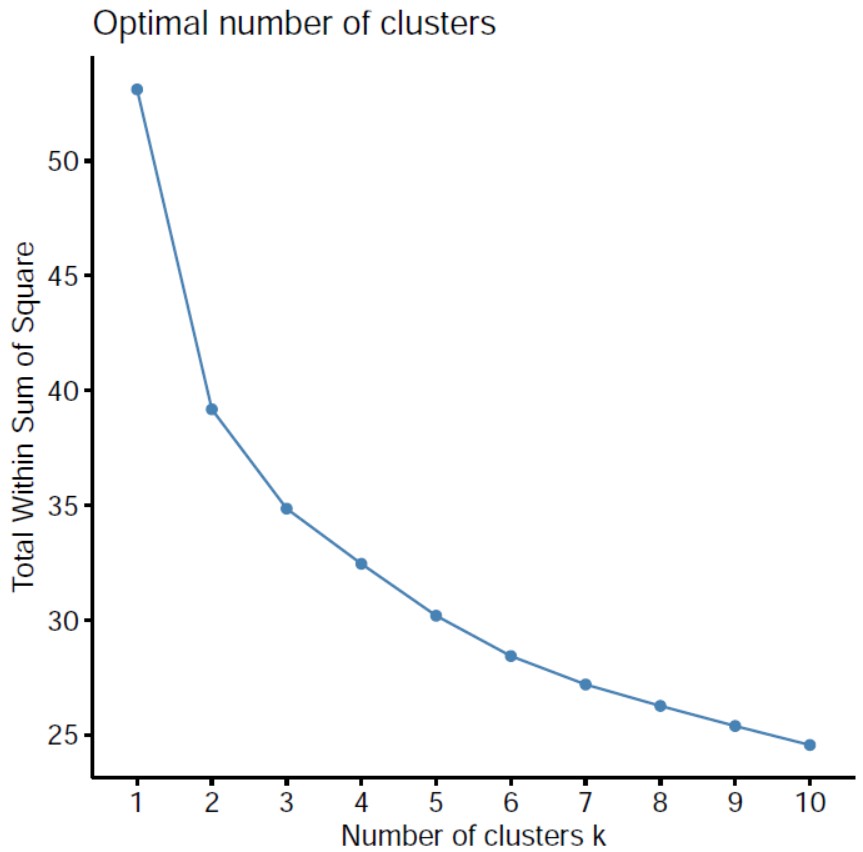
1.聚类数量选择:
探究模型确定聚成几类合适 ,用NbClust 包中的 NbClust 函数确定聚类K值 ;
sum of squared error (SSE)组内平方误差和来确定最佳聚类数目,随着聚类数目增多,每一个类别中数量越来越少,距离越来越近,因此WSS值肯定是随着聚类数目增多而减少的,所以关注的是斜率的变化,但WWS减少得很缓慢时,就认为进一步增大聚类数效果也并不能增强,存在得这个“肘点”就是最佳聚类数目,从一类到二类下降得很快,之后下降得很慢,所以最佳聚类个数选为2。
2. 层次聚类树:
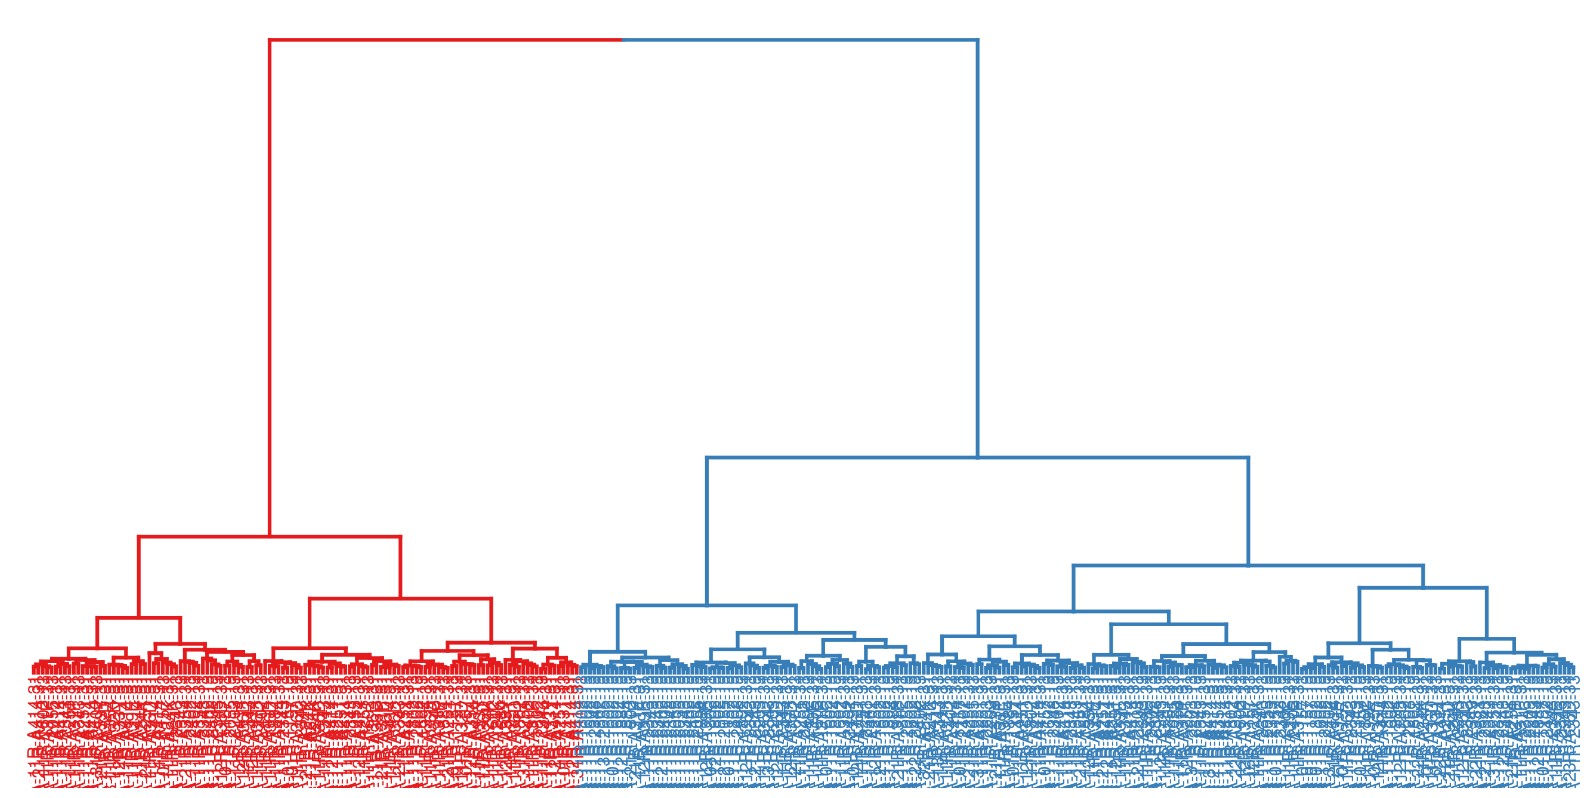
使用此方法参考文献:
文献1,胃癌免疫侵润层次聚类:Front Oncol (IF: 4.848; Q1). 2021 doi: 10.3389/fonc.2020.629909.
文献2,乳腺癌免疫侵润:Clin Cancer Res (IF: 10.107; Q1). 2019 Aug 15;25(16):5002-5014.
层次聚类原理详解:https://www.biaodianfu.com/hierarchical-clustering.html
- 发表于 2021-06-21 14:26
- 阅读 ( 3851 )
- 分类:TCGA
