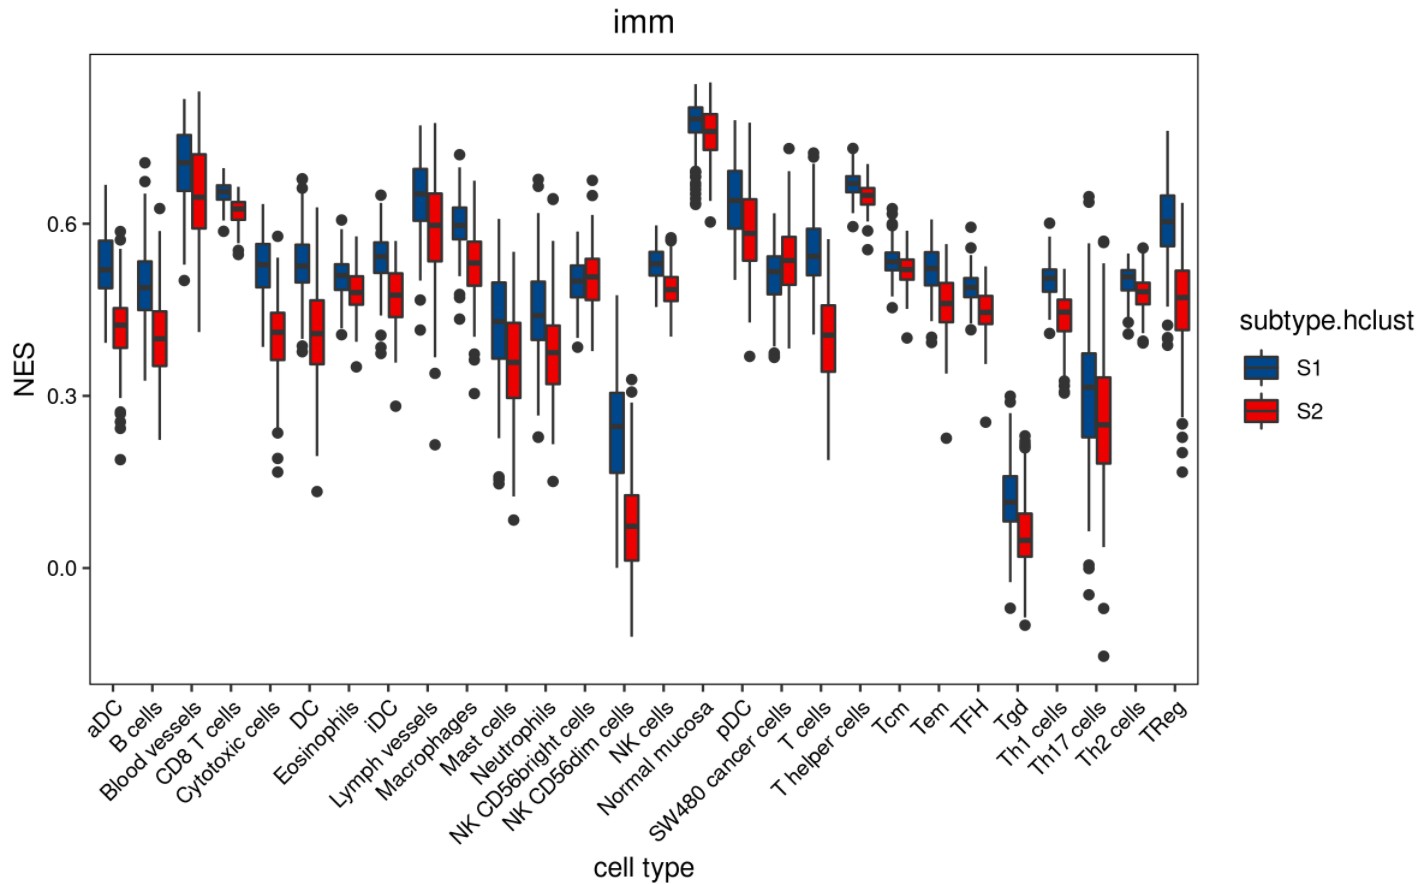
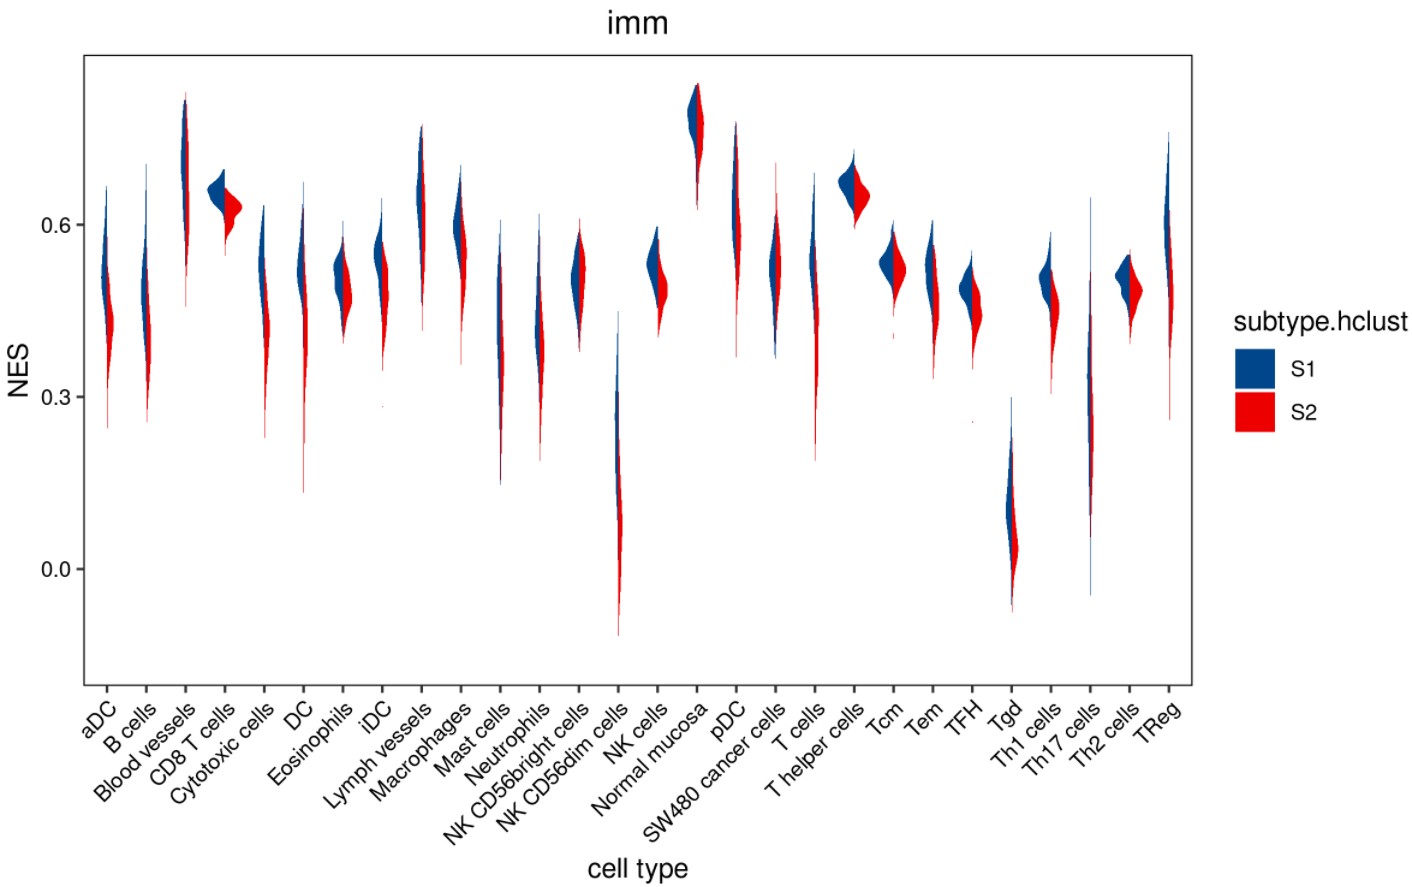
immune_box_plot.r 免疫侵润box分布图
immune_box_plot.r 免疫侵润box分布图
使用方法
$ Rscript $scriptdir/immune_box_plot.r -h
usage: immune_box_plot.r [-h] -i filepath -m
                                                       filepath -g group
                                                       [-b groupby]
                                                       [-p palette]
                                                       [-G geom [geom ...]]
                                                       [-T title] [-x xlab]
                                                       [-y ylab] [-o path]
                                                       [-n prefix] [-H number]
                                                       [-W number]
immune box plot : https://www.omicsclass.com/article/1497
optional arguments:
  -h, --help            show this help message and exit
  -i filepath, --input filepath
                        input immune result file[required]
  -m filepath, --metadata filepath
                        input metadata file path[required]
  -g group, --group group
                        group name from metadata to test[required]
  -b groupby, --groupby groupby
                        main group name from metadata to subset [default NULL]
  -p palette, --palette palette
                        fill palette in ggsci : eg npg lancet... for more
                        info:https://nanx.me/ggsci/articles/ggsci.html
                        [default lancet]
  -G geom [geom ...], --geom geom [geom ...]
                        set type of plot: boxplot, point, violin, splitviolin
                        [default=boxplot]
  -T title, --title title
                        the label for main title [optional, default: 'imm']
  -x xlab, --xlab xlab  input xlab [default cell type]
  -y ylab, --ylab ylab  input ylab [default fraction]
  -o path, --outdir path
                        output file directory [default cwd]
  -n prefix, --name prefix
                        out file name prefix [default demo]
  -H number, --height number
                        the height of pic inches [default 5]
  -W number, --width number
                        the width of pic inches [default 8]
使用命令举例
#box图展示
Rscript $scriptdir/immune_box_plot.r -i immu/ssgsea.res.tsv   \
  -m metadata.group.tsv -g subtype.hclust  -y NES  \
  -G boxplot  -o immu -n ssgse
#splitviolin图展示
Rscript $scriptdir/immune_box_plot.r -i immu/ssgsea.res.tsv   \
  -m metadata.group.tsv -g subtype.hclust  -y NES  \
  -G splitviolin  -o immu -n ssgse
绘图结果:


- 发表于 2021-06-22 12:11
- 阅读 ( 2517 )
- 分类:TCGA
你可能感兴趣的文章
- 胃癌免疫侵润预后Signature数据挖掘-糖酵解 3800 浏览
- 胃癌免疫侵润预后Signature数据挖掘-4.8分SCI思路解析 5204 浏览
- tsne_analysis.r 表达聚类分析 2794 浏览
- immune_compare_stat.r 免疫细胞表达差异比较 2108 浏览
- immune_bar_plot.r 免疫侵润分析bar绘图 2152 浏览
0 条评论
请先 登录 后评论
