enrichGSEA_pip.r GSEA富集分析
enrichGSEA_pip.R GSEA富集分析
使用说明:
$Rscript $scriptdir/enrichGSEA_pip.r -h
usage: /work/my_stad_immu/scripts/enrichGSEA_pip.r [-h] -a all.deg.file -g
                                                   gmtfile [-p pvalueCutoff]
                                                   [-t pvalueCutoff]
                                                   [-n prefix] [-o outdir]
                                                   [-H height] [-W width]
GSEA enrich analysis :https://www.omicsclass.com/article/1504
optional arguments:
  -h, --help            show this help message and exit
  -a all.deg.file, --all.deg.file all.deg.file
                        all diff express gene list file,must include log2FC
                        column, required
  -g gmtfile, --gmtfile gmtfile
                        GSEA gmtfile function class file, required
  -p pvalueCutoff, --pvalueCutoff pvalueCutoff
                        pvalue cutoff on enrichment tests to report,
                        [optional, default: 0.1 ]
  -t top, --top top
                        top NES for barplot [optional, default:10 ]
  -n prefix, --prefix prefix
                        the output file prefix [optional, default: GSEA ]
  -o outdir, --outdir outdir
                        output file directory [default cwd]
  -H height, --height height
                        the height of pic inches [default 5]
  -W width, --width width
                        the width of pic inches [default 5]
参数说明:
-a 输入差异基因分析所以的结果; 必须含有log2FC这列差异倍数信息,用于GSEA排序;
-g 指定 gmt文件 基因集: 更多GSEA功能富集数据下载:http://software.broadinstitute.org/gsea/downloads.jsp#msigdb
使用举例:
#更多GSEA功能富集数据下载:http://software.broadinstitute.org/gsea/downloads.jsp#msigdb
wget -c https://data.broadinstitute.org/gsea-msigdb/msigdb/release/7.4/c2.cp.kegg.v7.4.symbols.gmt

Rscript $scriptdir/enrichGSEA_pip.r   --all.deg.file $workdir/04.deg/S1_vs_S2.all.tsv \
  --gmtfile  c2.cp.kegg.v7.4.symbols.gmt -o GSEA -n S1_vs_S2_KEGG -p 0.05
结果展示:
富集结果:
Description为基因集的名字,setSize代表该基因集下的基因总数,enrichmentScore代表Enrichment score, NES代表归一化后的Enrichment score, pvalue,表征富集结果的可信度, qvalue是多重假设检验矫正后的p值。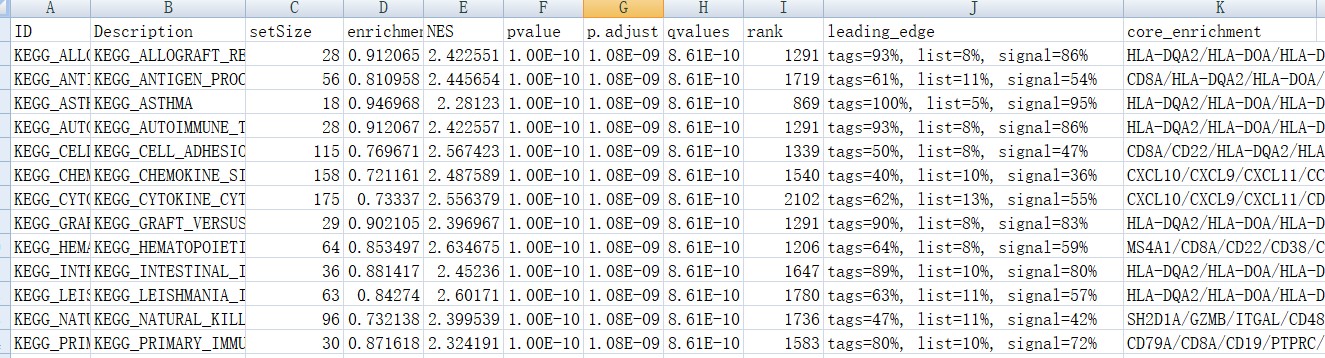
富集图:
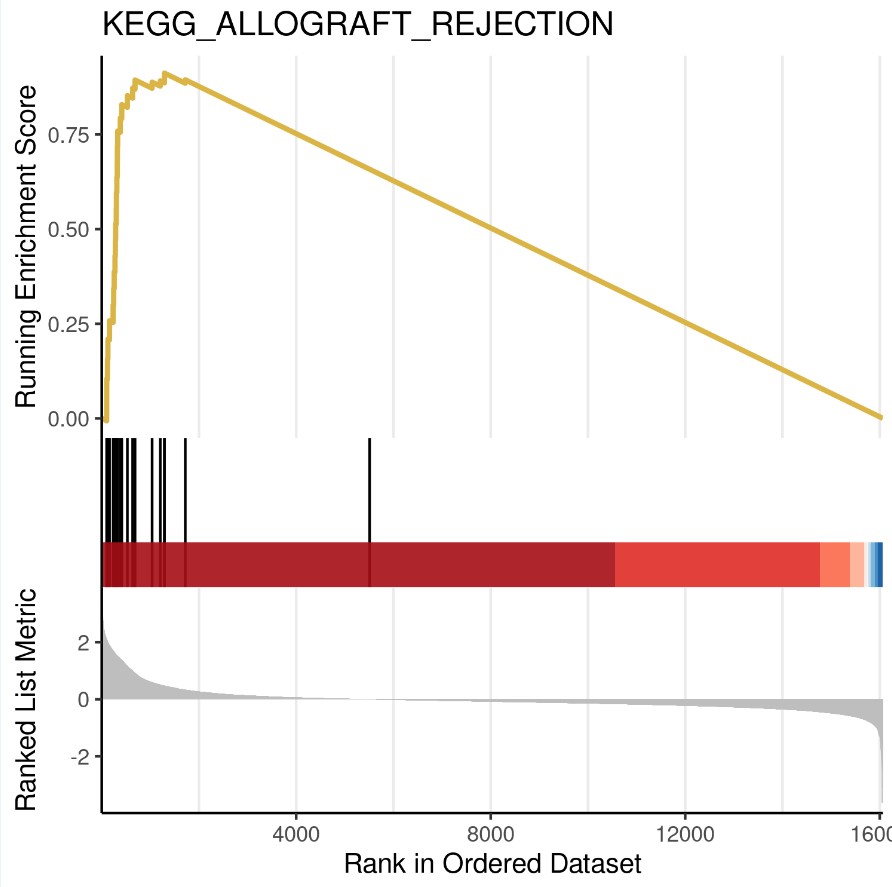
分成3个部分,
第一部分为基因Enrichment Score的折线图,横轴为该基因下的每个基因,纵轴为对应的Running ES, 在折线图中有个峰值,该峰值就是这个基因集的Enrichemnt score,峰值之前的基因就是该基因集下的核心基因。
第二部分为hit,用线条标记位于该基因集下的基因
第三部分为所有基因的rank值分布图, 对应了纵轴的标题。
参考文献:
Yu G, Wang L, Han Y, He Q (2012). “clusterProfiler: an R package for comparing biological themes among gene clusters.” OMICS: A Journal of Integrative Biology, 16(5), 284-287. doi: 10.1089/omi.2011.0118.
- 发表于 2021-06-23 13:39
- 阅读 ( 3351 )
- 分类:转录组
