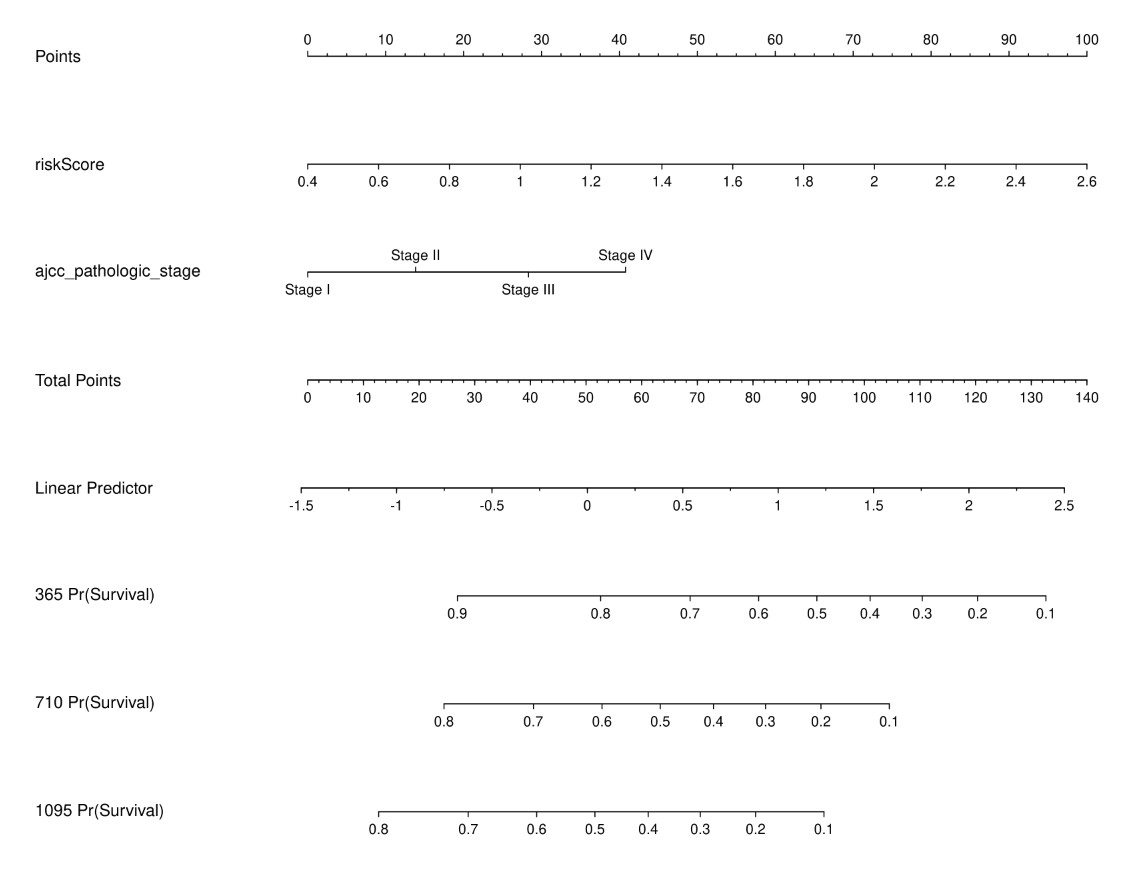
nomogram_multi_cox.r 多因素cox分析构建模型并绘制列线图nomogram
nomogram_multi_cox.r 多因素cox分析构建模型并绘制列线图nomogram
使用说明:
使用方法类似于基因表达量多因素cox分析https://www.omicsclass.com/article/1533 ,但这个脚本支持输入临床数据用于模型构建并绘制列线图,列线图用的R包rms;
$Rscript $scriptdir/nomogram_multi_cox.r -h
usage: /share/nas1/huangls/test/TCGA_immu/scripts/nomogram_multi_cox.r
       [-h] -i data -t time -e event -v variate [variate ...]
       [-P predict.time [predict.time ...]] [-c cut.score] [-s seed]
       [-o outdir] [-p prefix]
cox regression analysis gene expression
optional arguments:
  -h, --help            show this help message and exit
  -i data, --data data  input data file path[required]
  -t time, --time time  set suvival time column name [required]
  -e event, --event event
                        set event column name must 0 or 1 code format
                        [required]
  -v variate [variate ...], --variate variate [variate ...]
                        variate for cox analysis [required]
  -P predict.time [predict.time ...], --predict.time predict.time [predict.time ...]
                        Time point to draw the ROC curve [default 365 1095
                        1825]
  -c cut.score, --cut.score cut.score
                        set cut score value to divide high and low risk groups
                        [default median]
  -s seed, --seed seed  set random seed [default 2021]
  -o outdir, --outdir outdir
                        output file directory [default cwd]
  -p prefix, --prefix prefix
                        out file name prefix [default cox]
使用举例:
Rscript $scriptdir/nomogram_multi_cox.r -i nomogram_metadata.tsv -e EVENT -t TIME \
  -v riskScore      ajcc_pathologic_stage       -o multicox.nomogram\
  -p  multicox   -P 365 710 1095
结果展示:
 脚本获取与使用课程:https://study.163.com/course/introduction/1211864801.htm?share=1&shareId=1030291076
- 发表于 2021-08-30 17:25
- 阅读 ( 2688 )
- 分类:临床医学
你可能感兴趣的文章
相关问题
0 条评论
请先 登录 后评论
