影响GWAS关联分析好坏的因素
GWAS关联分析课程推荐:https://bdtcd.xetslk.com/s/2KgXQq
1996年,人类基因组还没有完成,二代高通量测序也还没有横空出世,测序还是一门昂贵的技术,但是已经有大牛在《SCIENCE》上预测,GWAS可以用于研究人类复杂疾病[1]。再后来随着高通量测序技术的发展,动植物领域利用GWAS进行数量性状基因定位也开始盛行。
到现在为止,动植物的GWAS已经发表了若干篇文章,大部分都是在CNNS系列杂志上发表。已经进行GWAS研究的物种包括玉米[2-10]、水稻[11-16]、大豆[17-20]、牛[21]、狗[22]、高粱[23,24]、番茄[25]、拟南芥[26]、芝麻[27]、毛果杨[28]等。
不过,在GWAS的研究中,有几条不可忽视的影响要素。今天科技君就和大家一起来了解下!
GWAS是什么
GWAS(Genome-Wide Association Study),即全基因组关联分析,是指在全基因组范围内找出存在的序列变异,不局限于单核苷酸多态性(SNP),还可以利用InDel、CNV 等变异类型,从中筛选出与目标性状相关的变异位点。关联分析是基于连锁不平衡来识别分子标记之间或候选基因与性状之间关系的方法。
何谓连锁不平衡?当两个基因座位A(等位基因A和a)和B(等位基因B和b)位于同一条染色体或是连锁群上,则认为他们在遗传上是连锁的。位点间的连锁程度用重组率r来衡量。重组率表示在一次减数分裂的过程中,两个连锁座位之间发生交换的概率。所谓连锁平衡指的是配子基因型的频率等于等位基因频率的乘积,在随机交配群体中,习惯上把配子基因型的实际频率与平衡时频率的偏差程度作为连锁不平衡度,用D表示,如:DAB=fAB-fAfB。连锁的程度决定了连锁不平衡的大小,即连锁越紧密,连锁不平衡度越高。
1
稀有变异和微效基因
GWAS分析可以检测目标性状常见的或候选的基因。但是一个性状可以由稀有的大效应变异控制,也可能是由许多常见的微效基因控制,这两类基因用GWAS研究也存在难度[29,30]。因为GWAS定位功效决定于对应标记能够解释的表型变异大小(图1a)[31],而表型变异决定于等位基因效应大小的差异和它们在样本中出现的频率。微效基因达到某一检测功效相对需要更大的群体样本量。
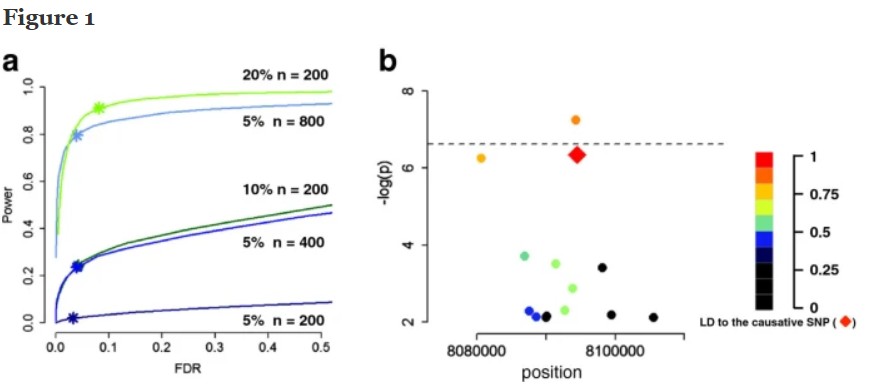
图1 群体大小和检测功效
a、假设一个SNP能解释5%、10%和20%的表型变异,模拟计算不同的群体大小下的检测功效和FDR值;b、模拟causative SNP(红色方块)并不是检测结果最显著的。[31]
那么如何提高稀有变异或微效基因的检测功效呢?解决的方法包括提高样本数、只针对目标区域进行基因分析和研究、提高遗传多样性、降低遗传背景噪音等。但是提高样本量也不一定能完全解决稀有变异的问题,最好是用连续多个标记作为整体标记来进行研究,未来单倍型作为标记进行GWAS研究也许会成为趋势。另对于稀有变异利用家系群体进行QTL定位可能效果会更好。
2
样本量大小
一些性状是由大效应的位点控制,进行GWAS研究需要的样本量比较低,即使低于100也能检测到有意义的位点[26]。对于复杂性状由若干的微效基因控制,那么样本量至少要达到几千[32,33]。从现在的动植物的发表文章来看,GWAS研究的样本数从100-5000不等[2-28]。从上一节我们也看到了,进行GWAS研究肯定是群体大了效果更好,同时群体大的情况下,LD相对会缩小,在标记密度足够的情况下,定位的区间小,有利于基因克隆。
那么如果不想定位效应很小或者频率很低的基因,我们可以用GWASpower/QT软件辅助群体大小的选择,通过输入遗传力、标记个数等参数,可以计算达到预期检测功效需要的群体大小。根据经验,一般情况下推荐群体大于300个,另外可以通过选择不同地理分布、表型差异大的品系,以最大化样本间的遗传变异,但是同时也可能引入遗传异质性。
3
遗传异质性
遗传异质性(genetic heterogeneity)是指某一种表型可以由不同的等位基因或者基因座突变所引起的现象。遗传异质性分为等位基因异质性和基因座异质性。
遗传异质性会降低变异检测的功效,因为它会减弱表型和任一变异的关联性,遗传异质性能够引起non-causative标记与表型关联性更强[34](图1b,图2)[31]。一个解决的方法是在混合模型中引入竞争性变异作为辅因子;另一方法是提高表型多样性高地区的样本量。
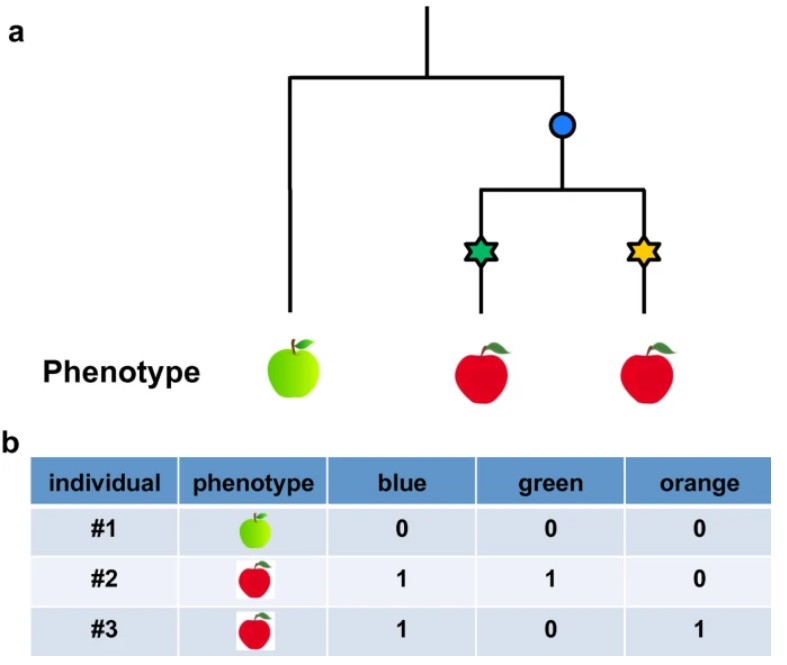
图2 遗传异质性导致综合性关联
a、进化关系树,星号是近期发生的能引起表型变化(红果)的突变位点;b、早期的蓝色突变不会引起果皮颜色的变化但是和其关联。[31]
4
群体结构
群体结构指的是不同的亚群间同一等位基因频率差异显著。遗传结构不同的混合群体也会产生不平衡,如下所示:
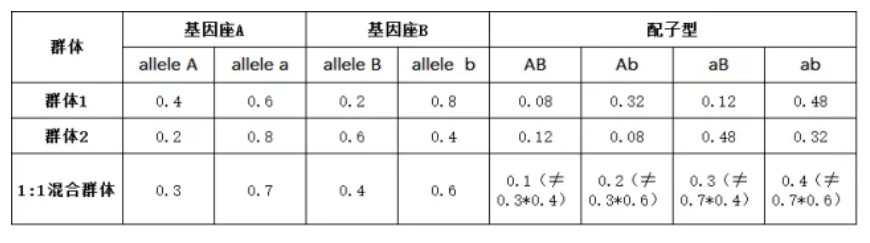
关联分析是基于连锁不平衡来识别分子标记之间或候选基因与性状之间关系的方法。如果样本是来自不同遗传结构的亚群,混合群体也会计算到连锁不平衡,但是这样两个基因座位间的不平衡是来源于群体结构,对于GWAS定位目标性状相关基因来说属于假阳性。
现在的一些算法(如混合模型),引入群体结构和亲缘关系作为协变量帮助解决群体结构对GWAS定位结果的影响[35],能有效的降低假阳性关联(图3)[31]。
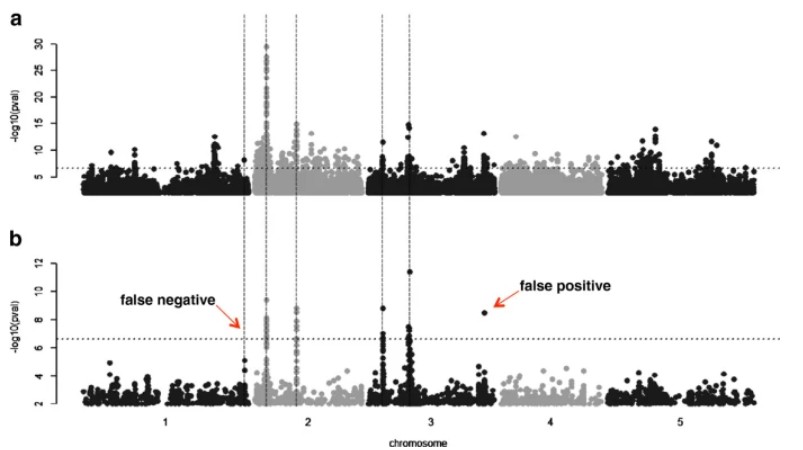
图3 GWAS结果manhattan plot
考虑群体结构以改善GWAS定位结果。五条竖虚线是模拟数据中预设的causative 位点,每个位点能解释最高10%的表型变异。a、一般线性模型结果;b、混合线性模型结果。前者假阳性较多,后者效果要好一些,但是同样存在一个假阳性和一个假阴性。[31]
群体结构对GWAS分析的结果影响大,虽然至今开发了若干的算法有助于消除群体结构的影响,但是有一些性状是和群体结构紧密连锁的,如植物的开花期[6],如果控制了群体结构那么就降低了此类性状的检测功效。当然我们可以在选样的过程中,控制群体结构,例如同时对籼稻和粳稻进行了群体遗传特性进行了分析,但是由于粳稻和籼稻间存在显著差异,在进行GWAS分析时只针对籼稻进行研究[11]。利用多群体衍生群体是一个不错的选择,康奈尔大学研究人员通过多个亲本和同一亲本杂交并不断自交构建了多亲本的NAM(Nested Association Mapping)群体,由于拥有统一的亲本作为遗传背景,打破了群体结构的影响[6]。多亲本衍生的群体可以结合连锁分析和关联分析的优点并克服二者的缺点,是QTL定位上佳的群体类型。要知道连锁分析和关联分析有哪些优缺点?可关注明天的微信。
5
标记密度不足
对于大多数表型来说,基于PCR的分子标记如SSR、SFLP等和现有的SNP分型芯片中可能并不包含所有的causal变异,那么在进行GWAS分析的过程中可能就意味着标记密度不足,无法检测到causative位点。
但是因为有连锁的存在,如果每个LD block上有标记,那么即使标记的数量不是特别多也能够用于GWAS分析。不过随着测序技术的发展,样本全基因组数据的获得使得标记密度和标记类型将不再是问题。全基因组水平的SNP、InDel和CNV等都可以作为标记进行GWAS研究。
参考文献:
1.Risch N, Merikangas K. The future of genetic studies of complex human diseases[J]. Science, 1996, 273(5281): 1516-1517.
2.Li H, Peng Z, Yang X, et al. Genome-wide association study dissects the genetic architecture of oil biosynthesis in maize kernels[J]. Nature genetics, 2013, 45(1): 43-50.
3.Chia J M, Song C, Bradbury P J, et al. Maize HapMap2 identifies extant variation from a genome in flux[J]. Nature genetics, 2012, 44(7): 803-807
4.Yu J, Buckler E S. Genetic association mapping and genome organization of maize[J]. Current Opinion in Biotechnology, 2006, 17(2):155–160.
5.Mcmullen M D, Stephen K, Hector Sanchez V, et al. Genetic Properties of the Maize Nested Association Mapping Population[J]. Science, 2009, 325(5941):737-.
6.Buckler E S, Holland J B, Bradbury P J, et al. The genetic architecture of maize flowering time.[J]. Science, 2009, 325(5941):714-.
7.Feng T, Bradbury P J, Brown P J, et al. Genome-wide association study of leaf architecture in the maize nested association mapping population[J]. Nature Genetics, 2011, 43(2):159-162.
8.Kump K L, Bradbury P J, Wisser R J, et al. Genome-wide association study of quantitative resistance to southern leaf blight in the maize nested association mapping population[J]. Nature genetics, 2011, 43(2): 163-168.
9.Poland J A, Bradbury P J, Buckler E S, et al. Genome-wide nested association mapping of quantitative resistance to northern leaf blight in maize.[J]. Proceedings of the National Academy of Science, 2011, 108(17):6893-6898.
10.Larsson S J, Lipka A E, Buckler E S. Lessons from Dwarf8 on the strengths and weaknesses of structured association mapping.[J]. Plos Genetics, 2013, 9(2):e1003246-e1003246.
11.Huang X, Wei X, Sang T, et al. Genome-wide association studies of 14 agronomic traits in rice landraces[J]. Nature genetics, 2010, 42(11): 961-967.
12.Huang X, Zhao Y, Wei X, et al. Genome-wide association study of flowering time and grain yield traits in a worldwide collection of rice germplasm[J]. Nature Genetics, 2012, 44(1):32-39.
13.Xie W, Wang G, Yuan M, et al. Breeding signatures of rice improvement revealed by a genomic variation map from a large germplasm collection[J]. Proceedings of the National Academy of Sciences, 2015, 112(39): E5411-E5419.
14.Si L, Chen J, Huang X, et al. OsSPL13 controls grain size in cultivated rice[J]. Nature genetics, 2016, 48(4): 447-456.
15.Yano K, Yamamoto E, Aya K, et al. Genome-wide association study using whole-genome sequencing rapidly identifies new genes influencing agronomic traits in rice[J]. Nature Genetics, 2016, 48(8): 927-934.
16.Wang H, Xu X, Vieira F G, et al. The power of inbreeding: NGS based GWAS of rice reveals convergent evolution during rice domestication[J]. Molecular plant, 2016.
17.Zhengkui Z, Yu J, Zheng W, et al. Resequencing 302 wild and cultivated accessions identifies genes related to domestication and improvement in soybean[J]. Nature Biotechnology, 2015, 33.
18.Zhou L, Wang S B, Jian J, et al. Identification of domestication-related loci associated with flowering time and seed size in soybean with the RAD-seq genotyping method[J]. Scientific reports, 2015, 5: 9350.
19.Valliyodan B, Qiu D, Patil G, et al. Landscape of genomic diversity and trait discovery in soybean[J]. Scientific reports, 2016, 6.
20.Valliyodan B, Qiu D, Patil G, et al. Landscape of genomic diversity and trait discovery in soybean[J]. Scientific reports, 2016, 6.
21.Daetwyler H D, Aurélien C, Hubert P, et al. Whole-genome sequencing of 234 bulls facilitates mapping of monogenic and complex traits in cattle [J]. Nature Genetics, 2014, 46(8):858-865.
22.Karlsson E K, Izabella B, Wade C M, et al. Efficient mapping of mendelian traits in dogs through genome-wide association.[J]. Nature Genetics, 2007, 39(11):1321-1328.
23.Morris G P, Ramu P, Deshpande S P, et al. Population genomic and genome-wide association studies of agroclimatic traits in sorghum[J]. Proceedings of the National Academy of Sciences, 2013, 110(2):453-458.
24.Morris G P, Ramu P, Deshpande S P, et al. Population genomic and genome-wide association studies of agroclimatic traits in sorghum[J]. Proceedings of the National Academy of Sciences, 2013, 110(2): 453-458.
25.Tao L, Guangtao Z, Junhong Z, et al. Genomic analyses provide insights into the history of tomato breeding[J]. Nature Genetics, 2014, 46:1220-1226.
26.Atwell S, Huang Y S, Vilhjálmsson B J, et al. Genome-wide association study of 107 phenotypes in Arabidopsis thaliana inbred lines[J]. Nature, 2010, 465(7298): 627-631.
27.Xin W, Kunyan L, Yanxin Z, et al.Genetic discovery for oil production and quality in sesame. Nature communication, 2015,| 6:8609
28.Evans L M, Slavov G T, Eli R M, et al. Population genomics of Populus trichocarpa identifies signatures of selection and adaptive trait associations[J]. Nature Genetics, 2014, 46(10):1089-1096.
29.Asimit J, Zeggini E. Rare variant association analysis methods for complex traits[J]. Annual review of genetics, 2010, 44: 293-308.
30.Gibson G. Rare and common variants: twenty arguments[J]. Nature Reviews Genetics, 2012, 13(2): 135-145.
31.Korte A, Farlow A. The advantages and limitations of trait analysis with GWAS: a review[J]. Plant methods, 2013, 9(1): 1.
32.Manolio T A, Collins F S, Cox N J, et al. Finding the missing heritability of complex diseases[J]. Nature, 2009, 461(7265): 747-753.
33.Bodmer W, Bonilla C. Common and rare variants in multifactorial susceptibility to common diseases[J]. Nature genetics, 2008, 40(6): 695-701.
34.Platt A, Vilhjálmsson B J, Nordborg M. Conditions under which genome-wide association studies will be positively misleading[J]. Genetics, 2010, 186(3): 1045-1052.
35.Kang H M, Zaitlen N A, Wade C M, et al. Efficient control of population structure in model organism association mapping[J]. Genetics, 2008, 178(3): 1709-1723.
- 发表于 2021-11-18 14:10
- 阅读 ( 6486 )
- 分类:GWAS
