用R做蛋白互作分析
采用R包STRINGdb 来进行蛋白互作网络分析
差异分析完成之后,可以做一个蛋白互作网络分析,看看差异蛋白只能有那些基因间存在相互作用。
实现这样的目标,方法有多种。一般比较常见的是采用STRING 这个网站,在网站上分析。其实采用R包STRINGdb也可以实现。代码参考如下:
############################################################
# 安装STRINGdb 软件包
# source("https://bioconductor.org/biocLite.R")
# biocLite("STRINGdb")
############################################################
library(STRINGdb)

# 设置程序参数
work_dir <- "/Users/zhangqiuxue/Documents/Train/TCGA/lab/PPI"
deg_file <- "/Users/zhangqiuxue/Documents/Train/TCGA/lab/DEG/DE_genes.txt"

setwd(work_dir)

# 获取物种的分类编号
# get_STRING_species(version="10", species_name=NULL)
# 9606 代表人类
string_db <- STRINGdb$new(version="10", species=9606,
                           score_threshold=700, input_directory= work_dir)

# 读取差异表达的文件,获得差异表达基因列表
degs = read.table(deg_file,header=T,comment.char = "",check.names=F)
degs$gene <- rownames(degs)
head(degs)

# 查看有多少差异表达的基因需要分析
cat("Total deg genes:", dim(degs)[1])

# 将基因的ID map 到string 数据库中, 不一定每个基因都能map上
deg_mapped <- string_db$map( degs, "gene", removeUnmappedRows = TRUE )

# 查看有多少ID map 上了
cat("Total String id mapped :", dim(deg_mapped)[1])


# 设置绘图相关的参数
options(SweaveHooks=list(fig=function()
  par(mar=c(2.1, 0.1, 4.1, 2.1))))

# 筛选出一部分结果,进行绘图
hits <- deg_mapped$STRING_id[1000]

# 绘图
string_db$plot_network( hits,required_score =700)


# 将所有的结果输出到文件,后面采用cytoscape 进行网络分析
info <- string_db$get_interactions(deg_mapped$STRING_id)
write.table(info, file = "STRING_info.txt",sep="\t", row.names =F, quote = F)

# 采用igraph 进行聚类分析
clustersList <- string_db$get_clusters(deg_mapped$STRING_id)

# 设置绘图参数
options(SweaveHooks=list(fig=function()
  par(mar=c(2.1, 0.1, 4.1, 2.1))))

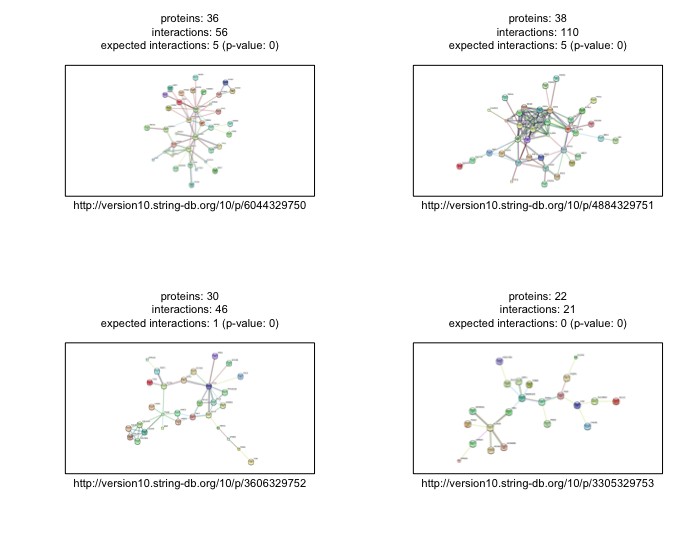
# 绘制前4个聚类图
par(mfrow=c(2,2))
for(i in seq(1:4)){
  string_db$plot_network(clustersList[[i]])
}
最后来看看效果吧,是不是在很多文章中见过?,其实在PPI网络构建完之后,还可以对网络进行分析,分析一些子网络和hug的基因。

- 发表于 2018-06-01 16:49
- 阅读 ( 7075 )
- 分类:蛋白质组学
你可能感兴趣的文章
- ppi_network.r 蛋白互作网络分析 3200 浏览
- LENS:人的基因相互作用分析在线工具 3659 浏览
相关问题
- cytoscape绘图问题 2 回答
- 做蛋白互作网络时报错 2 回答
0 条评论
请先 登录 后评论
