r绘图0不在原点的问题
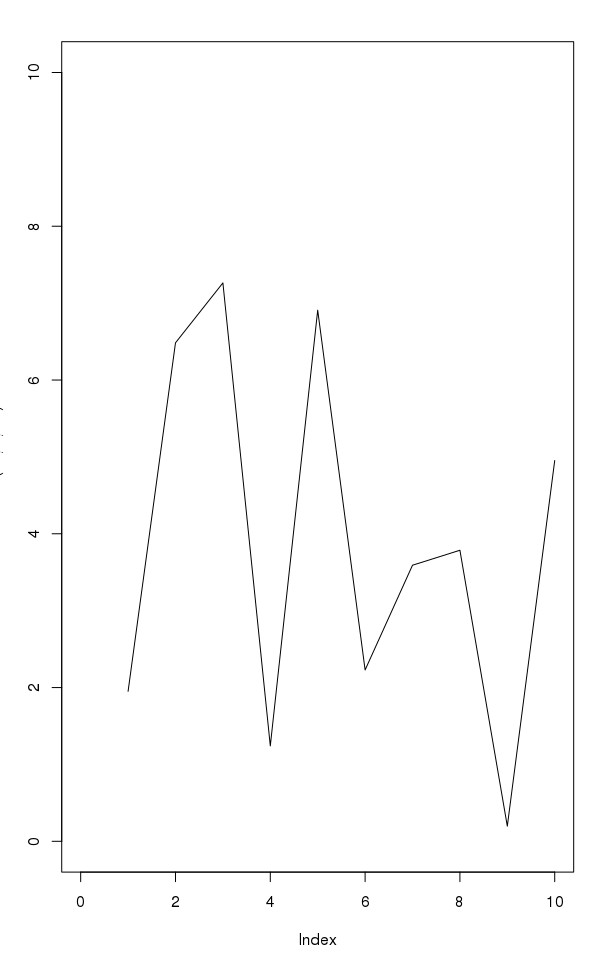
使用plot画图的时候,只是设定xy轴范围仍然在0之前会有一小段多出来的范围
例如:plot(runif(10,0,10),type="l",xlim=c(0,10),ylim=c(0,10))
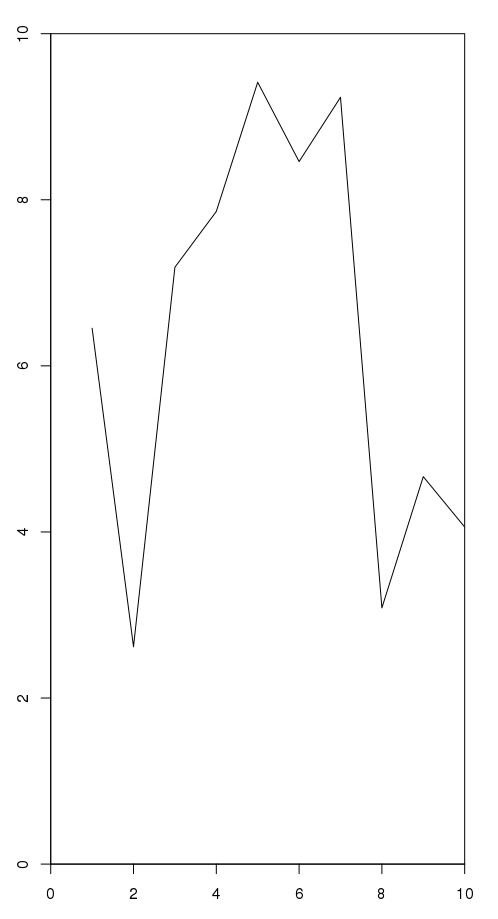
使用:xaxs/yaxs="i" 代码即可解决
例如:plot(r...
使用plot画图的时候,只是设定xy轴范围仍然在0之前会有一小段多出来的范围
例如:plot(runif(10,0,10),type="l",xlim=c(0,10),ylim=c(0,10))
 使用:xaxs/yaxs="i" 代码即可解决
例如:plot(runif(10,0,10),type="l",xlim=c(0,10),ylim=c(0,10),yaxs="i",xaxs="i")

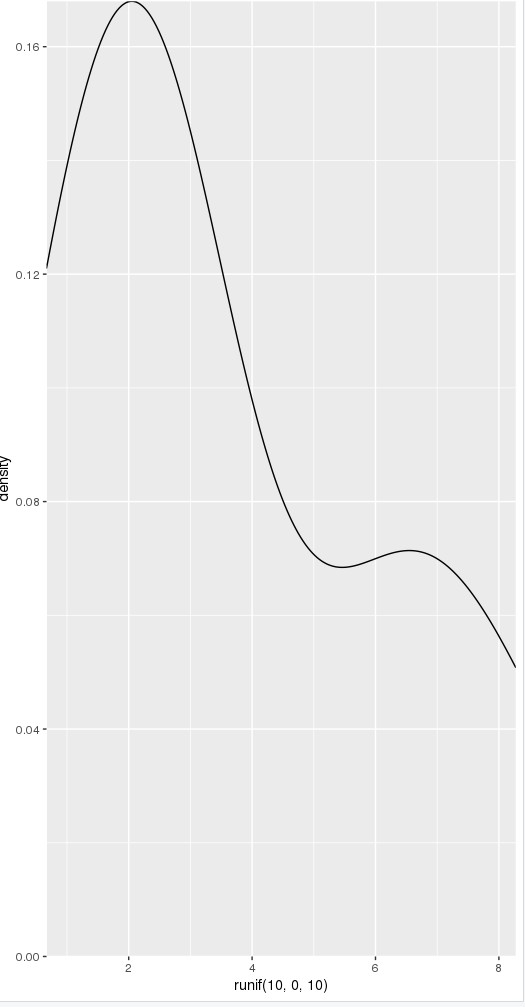
同样,ggplot也会有这个问题,处理方式为在图形p后加一段参数
scale_y_continuous(expand = c(0, 0))+
scale_x_continuous(expand = c(0, 0))
例如ggplot()+
geom_density(aes(x=runif(10,0,10)))+
scale_y_continuous(expand = c(0, 0))+
scale_x_continuous(expand = c(0, 0))
- 发表于 2022-10-21 17:29
- 阅读 ( 2944 )
- 分类:R
你可能感兴趣的文章
- 生物视频教程:生物统计和绘图必备的R语言技能 7640 浏览
- rainbow函数取色 13459 浏览
- Vennerable包venn返回结果绘图 4966 浏览
- rgb函数选择颜色(并控制深浅) 10590 浏览
- R语言统计数据范围并用ggplot2绘制饼图 9258 浏览
相关问题
- 运行MCScanX查找共线性,java绘图出现错误为什么? 2 回答
- XP-EHH 0 回答
- 老师您好,我想问一下下面这个图是怎么画出来的呢 1 回答
- 聚类热图(heatmap)如何绘制? 1 回答
- 韦恩图(Venn)如何绘制? 1 回答
0 条评论
请先 登录 后评论
