使用DNA序列做主成分分析(PCA)——R语言adegenet包
提到主成分分析,一般我们都是使用Plink,GCTA等软件基于SNP数据来操作,那么如何用DNA序列做主成分分析呢?
思路是先比对,之后使用R语言的adegenet包把比对的数据转换成snp数据,用到的函数是fasta2genlight(),再进行PCA分析及绘图。
提到主成分分析,一般我们都是使用Plink,GCTA等软件基于SNP数据来操作,那么如何用DNA序列做主成分分析呢?
思路是先比对,之后使用R语言的adegenet包把比对的数据转换成snp数据,用到的函数是fasta2genlight(),再进行PCA分析及绘图。
一、安装adegenet包
通过输入以下命令,确保你有一个 R (≥3.2.1)的最新版本:
R.version.string
[1] "R version 4.0.2 (2020-06-22)"
然后安装带有依赖关系的adegenet:
install.packages("adegent",dep=TRUE)如果有时候你不确定软件包的版本,你可以使用:
packageDescription("adegenet", fields = "Version")
[1] "2.1.3"
adegenet的版本应为2.1.3。
二、对象类
genind对象用于存储遗传标记数据,被用于单个基因型。特殊对象genlight类用于存储大型基因组范围的SNPs数据。
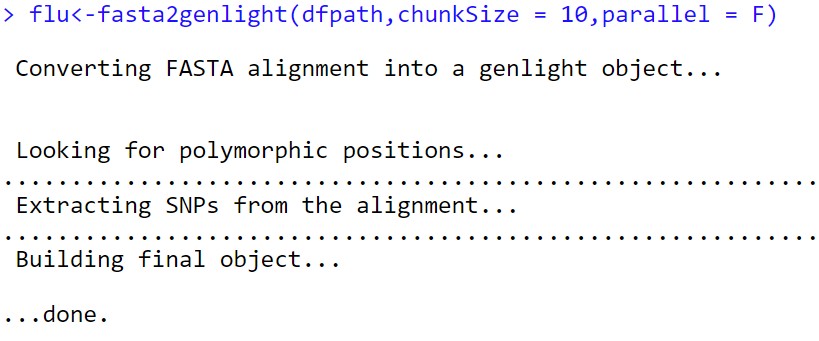
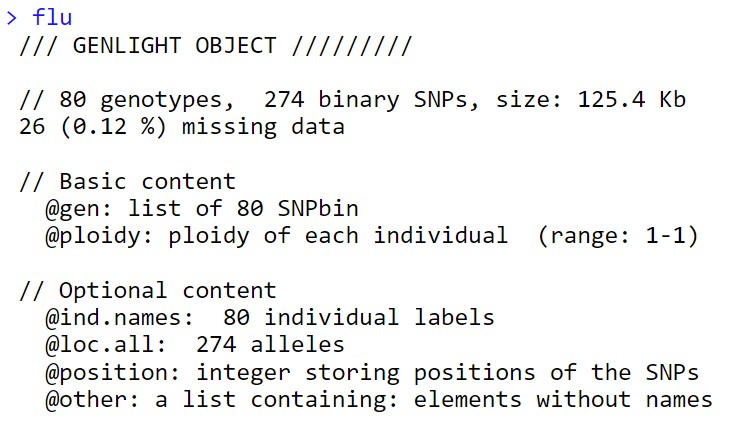
fasta2genlight()函数的主要作用就是从比对好的fasta文件中提取snp数据,存入到genlight对象中。
三、从DNA序列中提取多态性
可以通过 genind 对象或 genlight 对象来有效处理。
对于较大的(接近全基因组)数据集,可以使用 fasta2genlight 从 fasta文件中提取 SNPs 到 genlight 对象。对于DNA序列,genlight 对象更加方便。
使用的数据集是这个包的内置数据集,首先是获取这个数据集的存储路径
dfpath<-system.file("files/usflu.fasta",package="adegenet")
dfpath
加载包读入数据
library(adegenet)
flu<-fasta2genlight(dfpath,chunkSize = 10,parallel = F)
数据读入以后做一些分析就比较容易了
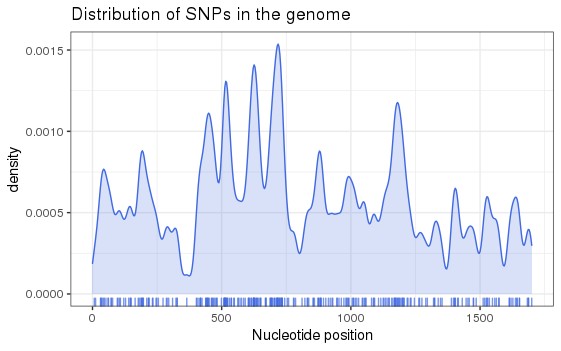
首先是看一下snp位点在染色体上的分布密度
library(ggplot2)
snpposi.plot(position(flu),genome.size = 1700,codon = F)
+     theme_bw()
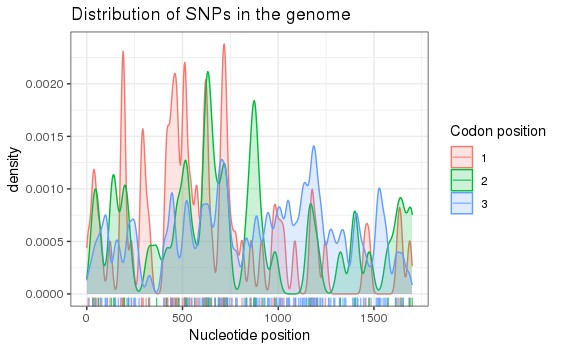
还可以划分不同的密码子位置
snpposi.plot(position(flu),genome.size = 1700,codon = T)
+     theme_bw()
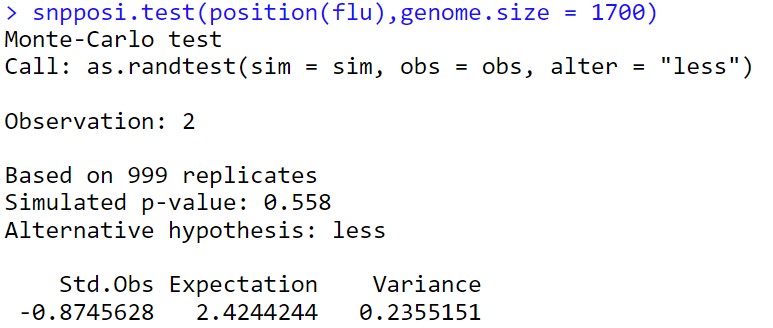
还能够检测snp在染色体上是否分布均匀
snpposi.test(position(flu),genome.size = 1700)
这一步的时间可能会比较长
四、主成分分析
1、计算pca特征向量
df.pca<-glPca(flu,nf=3)
df.pca.scores<-as.data.frame(df.pca$scores)
df.pca.scores
2、计算方差解释率
#计算标准差
sdev<- apply(df.pca.scores,2,sd)
sdev
#计算方差解释率
jsl<- sdev^2/sum(sdev^2)*100
jsl
      PC1       PC2       PC3
67.789393 23.930861  8.279746
3、分组信息
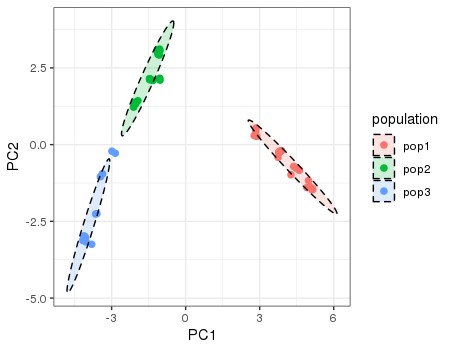
自己随便构造一个分组信息,然后用散点图加置信椭圆的方式展示结果
df.pca.scores$population<-ifelse(df.pca.scores$PC1>0,"pop1",
                                 ifelse(df.pca.scores$PC2>1,"pop2","pop3"))
若使用自己的数据,则输入准确的分组信息
a <- read.table(file="pop.txt")                 #1列,对应每条序列的分组信息
df.pca.scores$population <- factor(a$V1, levels=c("group1", "group2","group3",
                                                  "group4","group5","group6","group7",
                                                  "group8","group9"), ordered = FALSE)
4、主成分分析绘图
library(ggplot2)
ggplot()+
  geom_point(data=df.pca.scores,
             size=2,
             aes(x=PC1,y=PC2,
                 color=population))+
  theme_bw()+
  stat_ellipse(data=df.pca.scores,
               aes(x=PC1,y=PC2,fill=population),
               geom = "polygon",alpha=0.2,lty="dashed",color="black")
参考:adegenet包说明书 https://github.com/thibautjombart/adegenet/wiki/Tutorials
以及 https://zhuanlan.zhihu.com/p/348992700
- 发表于 2022-10-31 11:33
- 阅读 ( 5718 )
- 分类:科研作图
你可能感兴趣的文章
- R语言绘制多分组差异分析结果图 892 浏览
- 跟着文献学做图 | 用蛋白质序列做主成分分析(PCA) 4785 浏览
- 主成分分析(PCA)如何计算方差解释率 8528 浏览
- 群体遗传进化PCA分析 3199 浏览
- R语言基础入门—矩阵介绍 3181 浏览
0 条评论
请先 登录 后评论
