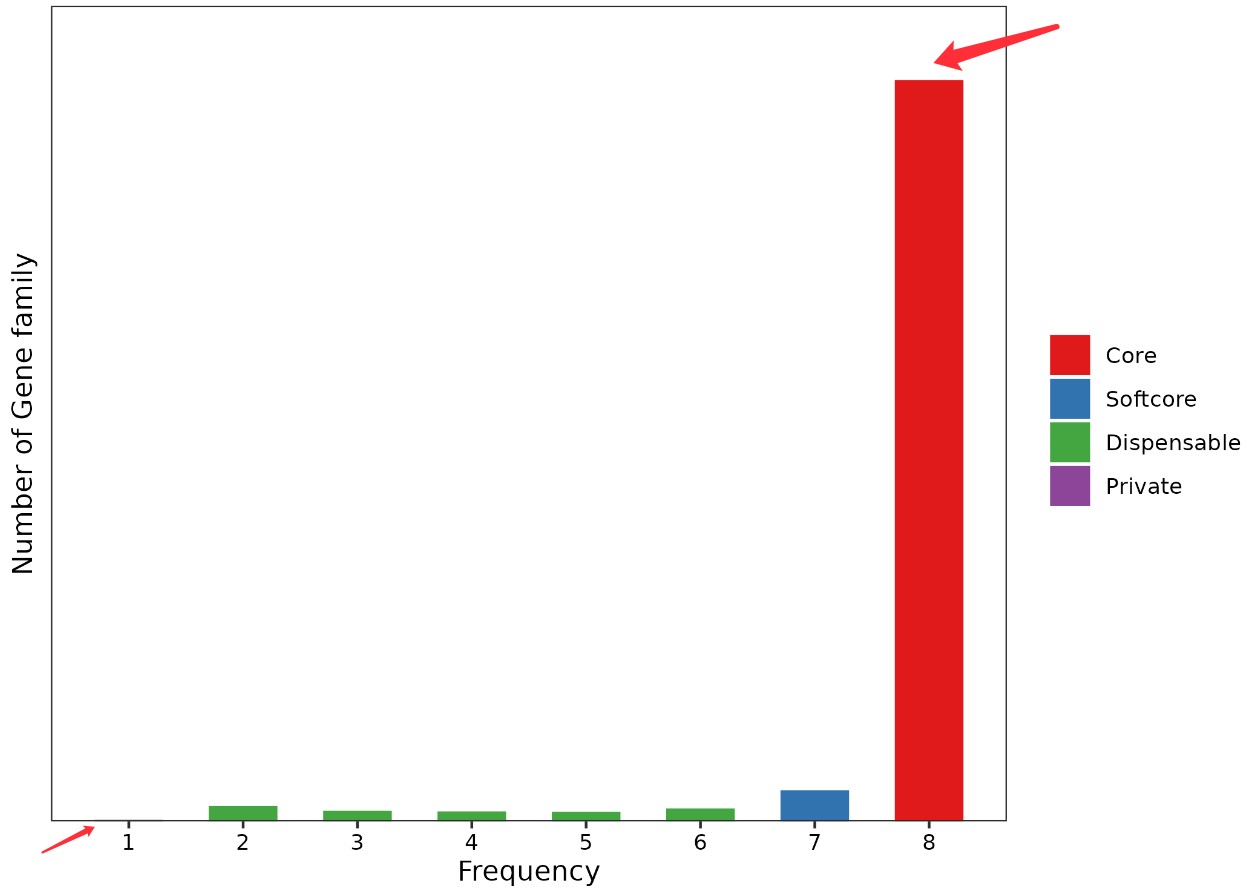
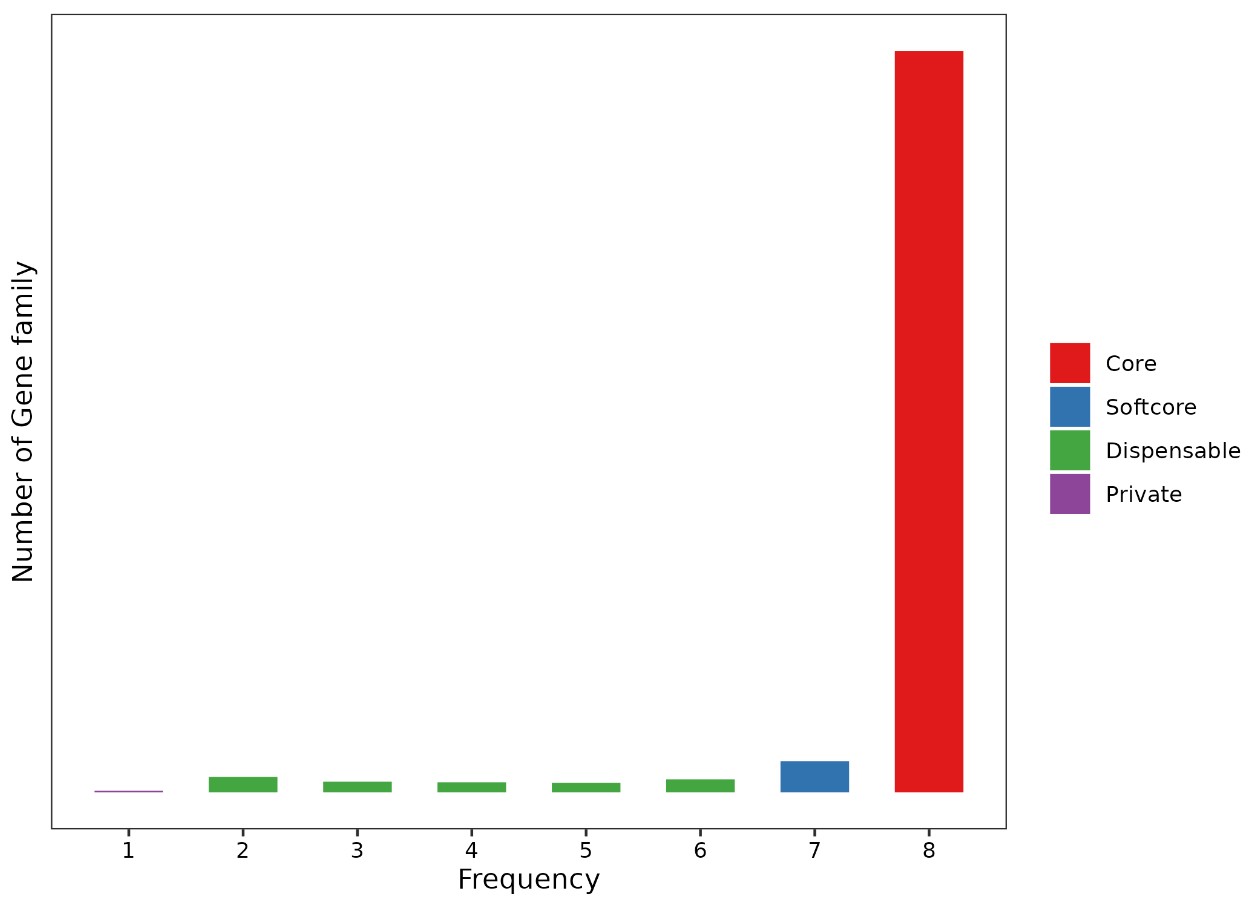
ggplot 柱状图,y轴从0 开始,最高柱子 留有余地代码:
ggplot 柱状图,y轴从0 开始,最高柱子 留有余地代码:
scale_y_continuous( expand = expansion(mult = c(0, .1))) # 添加此代码即可

未添加之前对比:

p1 <- ggplot(psum,aes( x=Count) ) +
  geom_bar(aes(fill = Class),width = 0.6) +
  ylab("Number of Gene family") +
  xlab("Frequency") +
  scale_x_continuous(breaks=1:sampleN)+
  scale_fill_manual(values = family_color,  # 设置颜色
                    name = NULL,  # 不显示图例标题
  ) +
  scale_y_continuous( expand = expansion(mult = c(0, .1))) +  # 设置y#################
  theme_bw() +
  theme(legend.title=element_blank(),
        axis.text.y=element_blank(),
        axis.ticks.y=element_blank(),
        #legend.position = c(0.9, 0.6),
        #legend.position = c(.95, .95),
        #legend.justification = c("right", "top"),
        axis.text.x=element_text(colour="black"),
        #axis.text.y=element_text(colour="black"),
        legend.box.just = "right",panel.grid=element_blank())
- 发表于 2023-06-08 17:34
- 阅读 ( 2792 )
- 分类:R
你可能感兴趣的文章
- 不均等坐标系绘制 1303 浏览
- cnv_dumbbell_plot.r 绘制哑铃图ggplot2包 3148 浏览
- 绘制展示基因在样本中表达量与数量的柱状图 4617 浏览
- ggplot中用字符窜传递变量名称列名等 2906 浏览
- ggplot2中各种主题元素修改对应方法函数速查表 5076 浏览
0 条评论
请先 登录 后评论
