PICRUSt2扩增子功能预测与差异比较分析
更好的阅读体验:https://mp.weixin.qq.com/s/-dvUrKd3gkENexF0SEP6Yg
picrust 简介
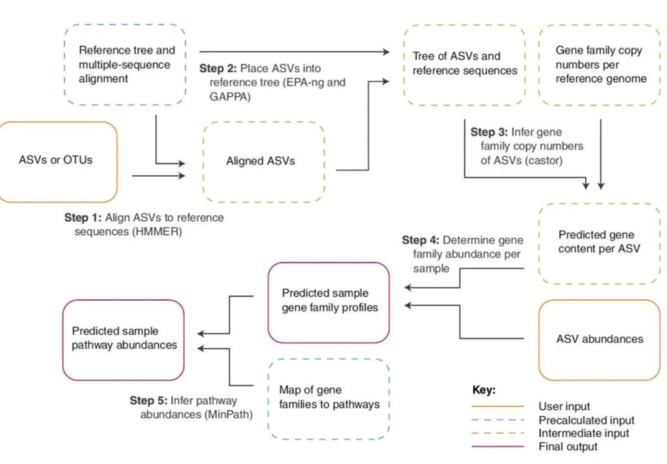
PICRUSt预测软件在2013年推出后受广大研究者青睐,这款软件依赖Greengene数据库,对输入的OTU信息进行比对,输出样本/分组的功能count值信息(图3)。通过对比研究发现在肠道微生物、土壤菌群等常规类型样本中,这种功能预测分析的结果与宏基因组测序获得的结果相当接近(部分样本相似度超过95%),说明预测结果能很大程度上反映样本的功能基因组成。PICRUSt1软件依赖于Greengene数据库进行物种比对、功能数据输出。而Greengene数据库在2013年之后就停止了更新,距今为止已有7年。随着时间的推移,大量微生物基因组数据测序获得,而停止更新的Greengene数据库限制了PICRUSt的功能预测范围。对于近年来测序获得微生物功能功能信息无法进行预测,满足不了当前的研究需求,成了这款软件的一块“短板”。为了补上这块“短板”,PICRUSt团队于升级了软件,正式公布了PICRUSt2。升级后的PICRUSt软件不再依赖于Greengene数据库进行比对,而是采用将待预测的OTU代表序列置于软件中已有的系统发育树中进行物种注释,使用IMG微生物基因组数据进行功能信息的输出。由于不再依赖于Greengene的OTU信息输入格式,使得PICRUSt2不但可以用于16s细菌、古菌的功能预测,也可以用于18S、ITS真菌、藻类的功能预测。当前用于真菌、藻类的数据库正在不断升级更新,预计在不久的将来真菌、藻类预测能力也能达到16s的水平。

扩增子功能预测分析
下面介绍两种方法利用PICRUSt2做功能预测分析:
### 自己手动运行#链接文件过来,qiime2分析的table和序列ln -s ../4.export_data/feature_table_tax.biom .ln -s ../4.export_data/dna-sequences.fasta .
#PICRUSt2提供流程一键完成f分析picrust2_pipeline.py -s dna-sequences.fasta -i feature_table_tax.biom -o picrust2_out_pipeline -p 20
#后续分析结果整理metagenome_pipeline.py -i feature_table_tax.biom -m picrust2_out_pipeline/marker_predicted_and_nsti.tsv.gz -f picrust2_out_pipeline/EC_predicted.tsv.gz \                       -o EC_metagenome_out --strat_outadd_descriptions.py -i EC_metagenome_out/pred_metagenome_unstrat.tsv.gz -m EC \                    -o EC_metagenome_out/pred_metagenome_unstrat_descrip.tsv.gzconvert_table.py EC_metagenome_out/pred_metagenome_contrib.tsv.gz \                 -c contrib_to_legacy \                 -o EC_metagenome_out/pred_metagenome_contrib.legacy.tsv.gz

pathway_pipeline.py -i EC_metagenome_out/pred_metagenome_contrib.tsv.gz \                    -o pathways_out -p 10add_descriptions.py -i pathways_out/path_abun_unstrat.tsv.gz -m METACYC \                    -o pathways_out/path_abun_unstrat_descrip.tsv.gz
另外,PICRUSt2可以作为插件安装到qiime2 中,利用qiime2的插件也可以分析:
# ########################## qiime2 插件:conda activate qiime2-2023.7 激活qiime2环境#链接文件过来ln -s ../3.asv_taxonomy/feature-table-final.qza .ln -s ../3.asv_taxonomy/repset-seqs-final.qza .

# qiime2 插件运行qiime picrust2 full-pipeline \   --i-table feature-table-final.qza \   --i-seq repset-seqs-final.qza \   --output-dir q2-picrust2_output \   --p-placement-tool sepp \   --p-threads 20 \   --p-hsp-method pic \   --p-max-nsti 2 \   --verbose

#绘制 汇总展示qiime feature-table summarize \   --i-table q2-picrust2_output/pathway_abundance.qza \   --o-visualization q2-picrust2_output/pathway_abundance.qzv

qiime feature-table summarize \   --i-table q2-picrust2_output/ec_metagenome.qza \   --o-visualization q2-picrust2_output/ec_metagenome.qzv

qiime feature-table summarize \   --i-table q2-picrust2_output/ko_metagenome.qza \   --o-visualization q2-picrust2_output/ko_metagenome.qzv

#功能多样性分析qiime diversity core-metrics \   --i-table q2-picrust2_output/pathway_abundance.qza \   --p-sampling-depth 226702 \   --m-metadata-file $fastmap \   --output-dir pathabun_core_metrics_out \   --p-n-jobs 10
#导出 功能风度表格qiime tools export \   --input-path q2-picrust2_output/pathway_abundance.qza \   --output-path pathabun_exported

#转换格式biom convert \   -i pathabun_exported/feature-table.biom \   -o pathabun_exported/feature-table.biom.tsv \   --to-tsv
结果分析与可视化
可以利用专门为PICRUSt2开发的R包ggpicrust2分析:代码分析如下:
library(readr)library(ggpicrust2)library(tibble)library(tidyverse)library(ggprism)library(patchwork)library(qiime2R)

setwd("/share/nas3/huangls/test/ampliseq/my_ampliseq/10.function_picrust/")

# Load metadata as a tibble# data(metadata)metadata <- read_delim("..//fastmap.ckd.txt", delim = "\t", escape_double = FALSE, trim_ws = TRUE)
#数据读入#qza(qiime2插件结果) qza=read_qza("pathway_abundance.qza")abundance_data=qza$data#picrust2分析结果abundance_data <- read.delim("path_abun_unstrat.tsv.gz",row.names = 1,header = T,check.names = F)
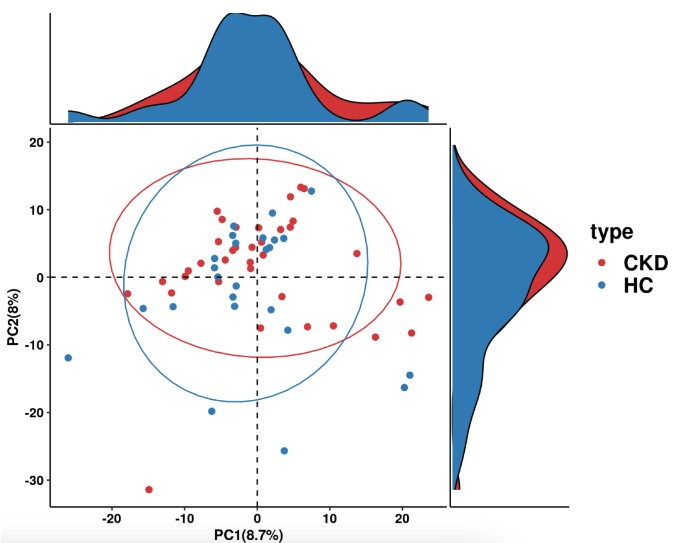
#  功能PCAf分析pathway_pca(abundance  = abundance_data, metadata = metadata, "type")

功能丰度差异比较分析
# Perform pathway DAA using ALDEx2 method# Please change column_to_rownames() to the feature column if you are not using example dataset# Please change group to "your_group_column" if you are not using example datasetdaa_results_df <- pathway_daa(abundance = abundance_data ,                               metadata = metadata,                               group = "type",                               daa_method = "ALDEx2",                               select = NULL,                               reference = NULL)

# Filter results for ALDEx2_Kruskal-Wallace test methoddaa_sub_method_results_df <- daa_results_df[daa_results_df$method == "ALDEx2_Wilcoxon rank test", ]

# Annotate pathway results without KO to KEGG conversion
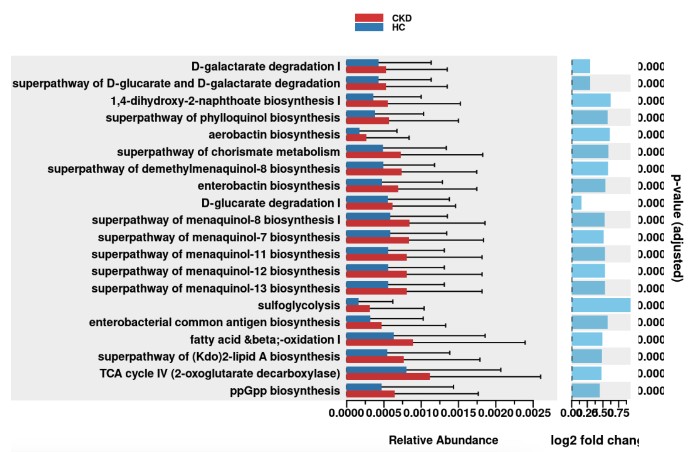
daa_annotated_sub_method_results_df <- pathway_annotation(pathway = pathway, daa_results_df = daa_sub_method_results_df, ko_to_kegg = F)# Generate pathway error bar plot# Please change column_to_rownames() to the feature column# Please change Group to metadata$your_group_column if you are not using example datasetpathway_errorbar(abundance = abundance_data , daa_results_df = daa_annotated_sub_method_results_df, Group = metadata$type, p_values_threshold = 0.05, order = "group",                      select = daa_annotated_sub_method_results_df %>% arrange(p_adjust) %>% slice(1:20) %>% dplyr::select(feature) %>% pull(),                       ko_to_kegg = FALSE,                       p_value_bar = TRUE,                       colors = NULL,                       x_lab = "description")

软件的安装
以上代码可以在扩增子镜像中运行,软件安装介绍就省了:可以使用docker镜像:
#下载镜像
docker pull omicsclass/ampliseq:v2.0
#启动镜像:
docker run --rm -it -v ~/ampliseq/:/work   omicsclass/ampliseq:v2.0
参考文献:
Douglas, G.M., Maffei, V.J., Zaneveld, J.R. et al. for prediction of metagenome functions. Nat Biotechnol 38, 685–688 (2020). https://doi.org/10.1038/s41587-020-0548-6
Chen Yang, Jiahao Mai, Xuan Cao, Aaron Burberry, Fabio Cominelli, Liangliang Zhang, ggpicrust2: an R package for PICRUSt2 predicted functional profile analysis and visualization, Bioinformatics, Volume 39, Issue 8, August 2023, btad470, https://doi.org/10.1093/bioinformatics/btad470
- 发表于 2023-10-24 11:42
- 阅读 ( 4154 )
- 分类:宏基因组
你可能感兴趣的文章
- 微生物与环境因子,代谢物,功能等相关性分析linkET 1928 浏览
- 微生物多样性扩增子(16S/18S/ITS)课程更新v2.0 1790 浏览
- 微生物多样性分类柱状图按照分组进行排序脚本升级;tax_bar_plot.r 2123 浏览
- qiime2 18S 分类器构建 3616 浏览
- 扩增子16S/ITS/18S微生物多样性课程更新-机器学习随机森林分析 3344 浏览
