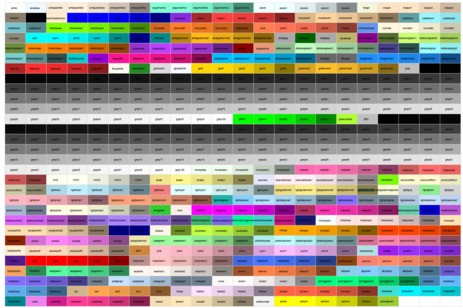
R 语言colors()657种颜色
R进行绘图多会涉及颜色搭配问题,利用colors()可以获得R种的657种颜色名称。
head(colors(),20) [1] "white" "aliceblue" "antiquewhite" "antiquewhite1" [5] "antiquewhite2" "...
R进行绘图多会涉及颜色搭配问题,利用colors()可以获得R种的657种颜色名称。
head(colors(),20)
 [1] "white"         "aliceblue"     "antiquewhite"  "antiquewhite1"
 [5] "antiquewhite2" "antiquewhite3" "antiquewhite4" "aquamarine"
 [9] "aquamarine1"   "aquamarine2"   "aquamarine3"   "aquamarine4"
[13] "azure"         "azure1"        "azure2"        "azure3"
[17] "azure4"        "beige"         "bisque"        "bisque1"
每个颜色名称具体对应的颜色,可以通过绘图呈现出来
pdf(file = "RColors.pdf",height = 20,width = 30)
par(mar=c(0,0,0,0))
plot(0, 0, type = "n", xlim = c(0, 1), ylim = c(0, 1), axes = FALSE, xlab = "", ylab = "")
line=30
col=22
rect(  rep((0:(col - 1)/col),line) ,  sort(rep((0:(line - 1)/line),col),decreasing=T)   ,   rep((1:col/col),line) , sort(rep((1:line/line),col),decreasing=T),  border = "light gray" , col=colors()[seq(1,line*col)])
text(  rep((0:(col - 1)/col),line)+0.02 ,  sort(rep((0:(line - 1)/line),col),decreasing=T)+0.015 , colors()[seq(1,line*col)]  , cex=0.9)
dev.off()

颜色文档下载:
如果想提升自己的绘图技能,我们推荐:R语言绘图基础(ggplot2)
更多生物信息课程:
1. 文章越来越难发?是你没发现新思路,基因家族分析发2-4分文章简单快速,学习链接:基因家族分析实操课程、基因家族文献思路解读
2. 转录组数据理解不深入?图表看不懂?点击链接学习深入解读数据结果文件,学习链接:转录组(有参)结果解读;转录组(无参)结果解读
3. 转录组数据深入挖掘技能-WGCNA,提升你的文章档次,学习链接:WGCNA-加权基因共表达网络分析
4. 转录组数据怎么挖掘?学习链接:转录组标准分析后的数据挖掘、转录组文献解读
5. 微生物16S/ITS/18S分析原理及结果解读、OTU网络图绘制、cytoscape与网络图绘制课程
6. 生物信息入门到精通必修基础课:linux系统使用、perl入门到精通、perl语言高级、R语言入门、R语言画图
7. 医学相关数据挖掘课程,不用做实验也能发文章:TCGA-差异基因分析、GEO芯片数据挖掘、GEO芯片数据标准化、GSEA富集分析课程、TCGA临床数据生存分析、TCGA-转录因子分析、TCGA-ceRNA调控网络分析
8.其他,二代测序转录组数据自主分析、NCBI数据上传、二代测序数据解读
- 发表于 2018-08-10 14:29
- 阅读 ( 14263 )
- 分类:R
你可能感兴趣的文章
- corrplot包绘制相关性图,简单又好看! 92 浏览
- 已知集合交集数量绘制韦恩图 382 浏览
- 绘制Upset 图 1672 浏览
- R公式中如何加入变量 755 浏览
- R语言基础入门—数据结构(2) 774 浏览
- R语言基础入门—数据结构(1) 723 浏览
0 条评论
请先 登录 后评论
