UpSetR包绘制多维的venn图
UpSetR包绘制多维的venn图
R 语言中的维恩图绘制有很多包,Vennerable(最多9维),VennDigram(最多5维),venn(最多7维),而UpSetR绘制的维恩图则更多,只是表现形式和其他图不太一样。示例代码不一样:
#devtools::install_github("hms-dbmi/UpSetR")
library(UpSetR)

A <-sample(1:1000, 400, replace = FALSE);
B <-sample(1:1000, 600, replace = FALSE);
C <-sample(1:1000, 350, replace = FALSE);
D <-sample(1:1000, 550, replace = FALSE);
E <-sample(1:1000, 375, replace = FALSE);
G <-sample(1:1000, 200, replace = FALSE);
H <-sample(1:1000, 777, replace = FALSE);

dataForUpSetPlot <-list(A=A, B=B, C=C, D=D, E=E, G=G, H=H)
setsBarColors <-c('#EA4335', '#FBBC05', '#34A853', '#4285F4')

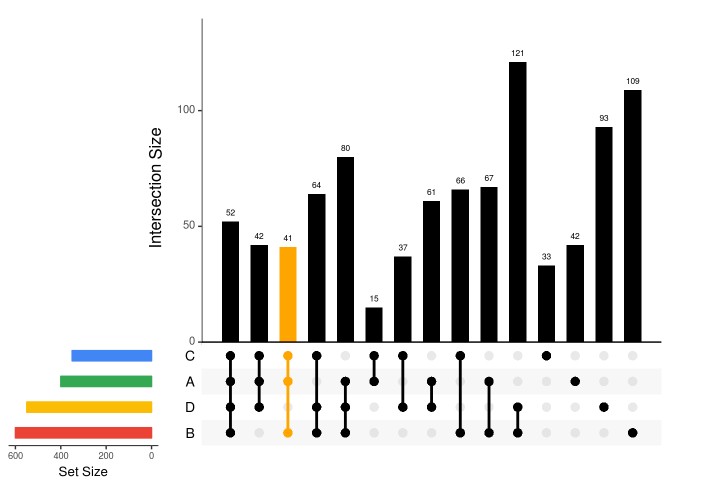
### sort by degree
upset(fromList(dataForUpSetPlot),
      nsets=length(dataForUpSetPlot),
      nintersects = 1000,
      sets = c("A", "B", "C", 'D'),
      #keep.order = TRUE,
      point.size = 3,
      line.size = 1,
      number.angles = 0,
      text.scale = c(1.5, 1.2, 1.2, 1, 1.5, 1), # ytitle, ylabel, xtitle, xlabel, sets, number
      order.by="degree",
      matrix.color="black",
      main.bar.color = 'black',
      mainbar.y.label = 'Intersection Size',
      sets.bar.color=setsBarColors,
      queries = list(list(query = intersects,
           params = list('A','B','C'), color = "orange", active = T)))

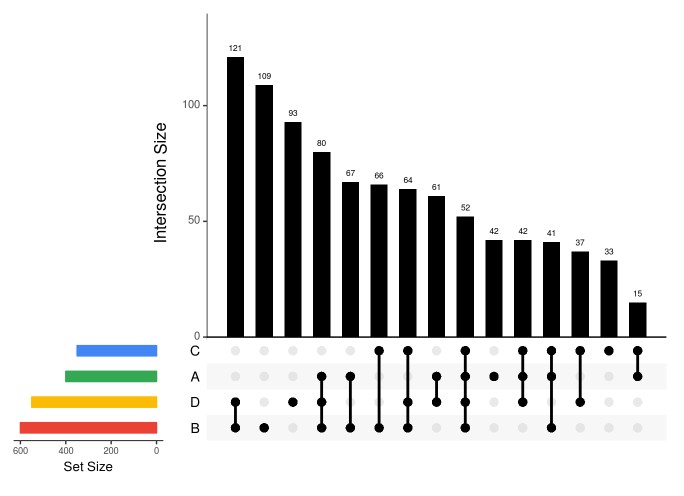
### sort by frequency of intersection
upset(fromList(dataForUpSetPlot),
      nsets=length(dataForUpSetPlot),
      nintersects = 1000,
      sets = c("A", "B", "C", 'D'),
      #keep.order = TRUE,
      point.size = 3,
      line.size = 1,
      number.angles = 0,
      text.scale = c(1.5, 1.2, 1.2, 1, 1.5, 1), # ytitle, ylabel, xtitle, xlabel, sets, number
      order.by="freq",
      matrix.color="black",
      main.bar.color = 'black',
      mainbar.y.label = 'Intersection Size',
      sets.bar.color=setsBarColors)

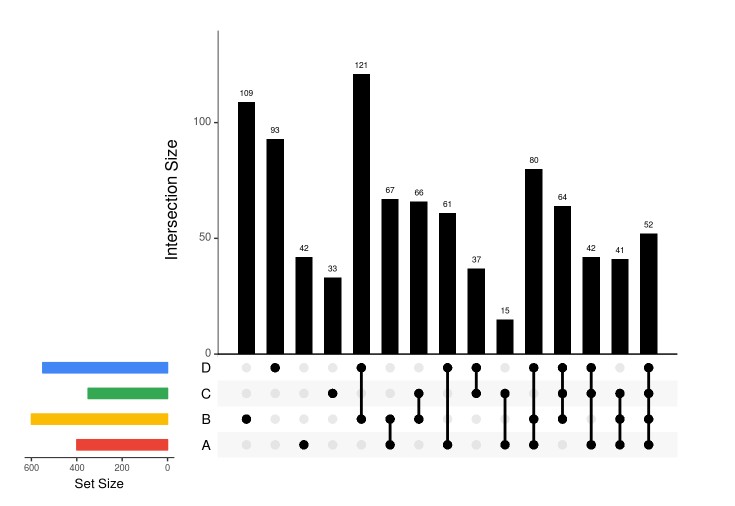
### sort by degree, then frequency, keep order
upset(fromList(dataForUpSetPlot),
      nsets=length(dataForUpSetPlot),
      nintersects = 1000,
      sets = c("A", "B", "C", 'D'),
      keep.order = TRUE,
      point.size = 3,
      line.size = 1,
      number.angles = 0,
      text.scale = c(1.5, 1.2, 1.2, 1, 1.5, 1), # ytitle, ylabel, xtitle, xlabel, sets, number
      #order.by="degree",
      matrix.color="black",
      main.bar.color = 'black',
      mainbar.y.label = 'Intersection Size',
      sets.bar.color=setsBarColors)

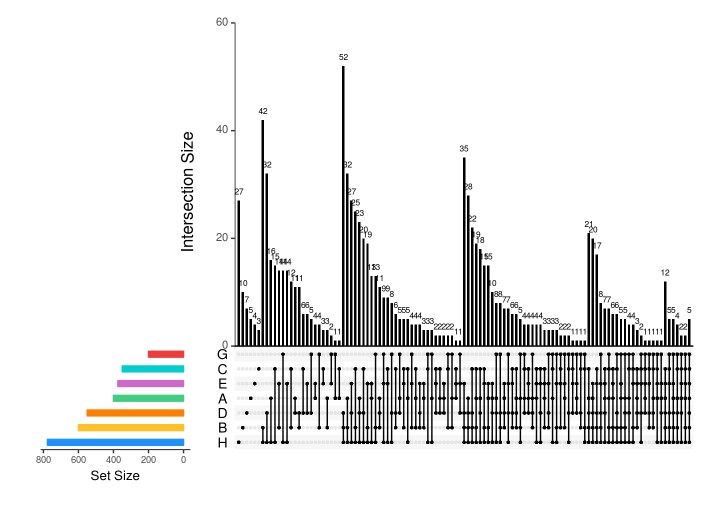
### all sets
setsBarColors <-c("dodgerblue", "goldenrod1", "darkorange1", "seagreen3", "orchid3", 'cyan3', 'brown2')

upset(fromList(dataForUpSetPlot),
      nsets=length(dataForUpSetPlot),
      nintersects = 1000,
      #sets = c("A", "B", "C", 'D','E','G','H'),
      #keep.order = TRUE,
      point.size = 1,
      line.size = 0.5,
      number.angles = 0,
      text.scale = c(1.5, 1.2, 1.2, 1, 1.5, 1), # ytitle, ylabel, xtitle, xlabel, sets, number
      #order.by="degree",
      matrix.color="black",
      main.bar.color = 'black',
      mainbar.y.label = 'Intersection Size',
      sets.bar.color=setsBarColors)

更多生物信息课程:
1. 文章越来越难发?是你没发现新思路,基因家族分析发2-4分文章简单快速,学习链接:基因家族分析实操课程、基因家族文献思路解读
2. 转录组数据理解不深入?图表看不懂?点击链接学习深入解读数据结果文件,学习链接:转录组(有参)结果解读;转录组(无参)结果解读
3. 转录组数据深入挖掘技能-WGCNA,提升你的文章档次,学习链接:WGCNA-加权基因共表达网络分析
4. 转录组数据怎么挖掘?学习链接:转录组标准分析后的数据挖掘、转录组文献解读
5. 微生物16S/ITS/18S分析原理及结果解读、OTU网络图绘制、cytoscape与网络图绘制课程
6. 生物信息入门到精通必修基础课:linux系统使用、biolinux搭建生物信息分析环境、linux命令处理生物大数据、perl入门到精通、perl语言高级、R语言画图、R语言快速入门与提高
7. 医学相关数据挖掘课程,不用做实验也能发文章:TCGA-差异基因分析、GEO芯片数据挖掘、 GEO芯片数据不同平台标准化 、GSEA富集分析课程、TCGA临床数据生存分析、TCGA-转录因子分析、TCGA-ceRNA调控网络分析
8.其他,二代测序转录组数据自主分析、NCBI数据上传、二代fastq测序数据解读、
9.全部课程可点击:组学大讲堂视频课程
- 发表于 2019-08-19 11:31
- 阅读 ( 10203 )
- 分类:R
你可能感兴趣的文章
- 已知集合交集数量绘制韦恩图 273 浏览
- 绘制venn图,2-7维 1202 浏览
- 使用R包(VennDiagram)进行韦恩图绘制时相关参数调整 3541 浏览
- R包venn绘制韦恩图 5159 浏览
- 3分钟学会画venn图(维恩图、韦恩图) 21485 浏览
3 条评论
请先 登录 后评论
