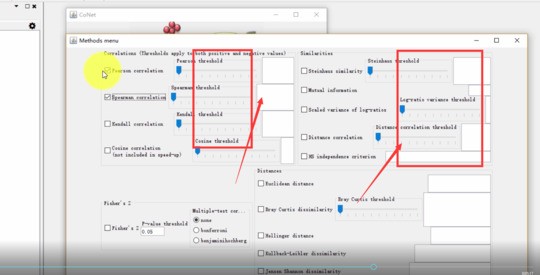
5 conet构建网络图参数设置
回答问题即可获得 10 经验值,回答被采纳后即可获得 10 金币。
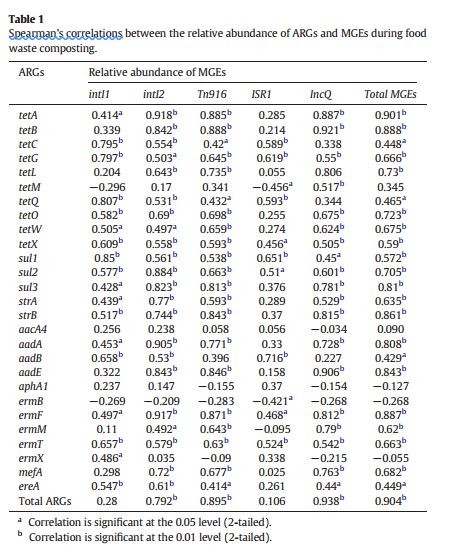
老师您好,关于参数设置的部分,在文献中方法部分有提到“Pairwise correlations were determined using Pearson and Spearman correlations as described previously. Only relatively large correlation coefficients (ρ > 0.8 and p<0.01) detected with both methods (Pearson and Spearman) were included into network analyses to minimize false-positive correlations.
”结果部分提高“A Procrustes analysis based on bacterial OTUs and ARG abundances
showed that ARGs significantly correlated with the bacterial community composition ( M(平方)= 0.5675, R = 0.7407, P <0.0001, 9999 permutations)
” 文章还列出个元素之间的spearson 系数,如下图。我想问一下,在制图过程中,怎么设置这个ρ和p的范围呢,是在conet 的method mean这个菜单中填入相应的值吗,还有permutations和bootstrap这个值是怎么设置的呢?那个spearson correlation 在计算之后又是如何查看的呢?谢谢老师!
请先 登录 后评论
- 1 关注
- 0 收藏,4962 浏览
- yiyi0523 提出于 2019-06-11 10:56
