不知道你用的是什么脚本, 如果贴一下代码,我可以告诉你怎么修改代码;
再R语言里面对数转换很简单: log2(x)
不知道你用的是什么脚本, 如果贴一下代码,我可以告诉你怎么修改代码;
再R语言里面对数转换很简单: log2(x)
如果觉得我的回答对您有用,请随意打赏。你的支持将鼓励我继续创作!

library("argparse")
parser <- ArgumentParser(description='plot geneExp heatmap')
parser$add_argument( "-i", "--input", type="character",required=T,
help="input gene expreesion matrix data ,[required]",
metavar="filepath")
parser$add_argument("-s", "--showrownames", action='store_true',
help="whether show rownames [optional, default: False]")
parser$add_argument( "-c", "--color", type="character",nargs='+',required=F,default=c("blue", "white", "red"),
help="color map of heatmap, give three color [default=c('blue', 'white', 'red')",
metavar="color")
parser$add_argument( "-o", "--outdir", type="character", default=getwd(),
help="output file directory [default cwd]",
metavar="outdir")
parser$add_argument("-n", "--name", type="character", default="heatmap",
help="out file name prefix [default heatmap]",
metavar="prefix")
parser$add_argument( "-H", "--height", type="double", default=8,
help="the height of pic inches [default 8]",
metavar="height")
parser$add_argument("-W", "--width", type="double", default=5,
help="the width of pic inches [default 5]",
metavar="width")
opt <- parser$parse_args()
if( !file.exists(opt$outdir) ){
if( !dir.create(opt$outdir, showWarnings = FALSE, recursive = TRUE) ){
stop(paste("dir.create failed: outdir=",opt$outdir,sep=""))
}
}
library(pheatmap)
#-----------------------------------------------------------------
# reading data
#-----------------------------------------------------------------
df<-read.table(opt$input,sep="\t",row.names=1,header = TRUE,check.names=FALSE,comment.char="")
#去除表达量全为零的行
if(sum(rowSums(df)==0)>0){
print(c("去除在所有的样本中表达量都为0的基因:",rownames(df)[rowSums(df)==0]))
df=df[rowSums(df)!=0,]
}
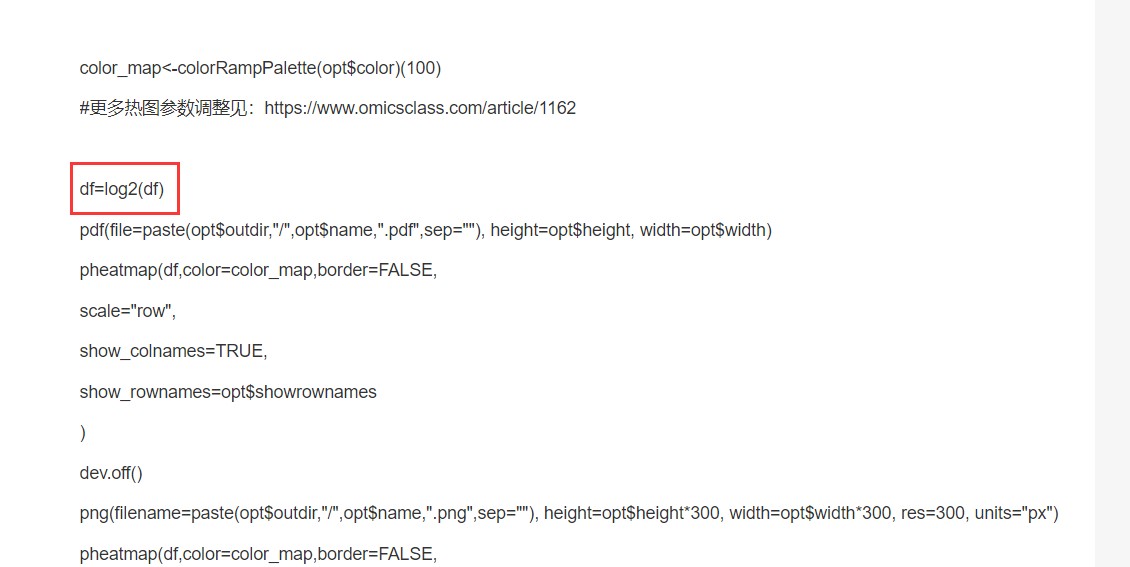
color_map<-colorRampPalette(opt$color)(100)
#更多热图参数调整见:https://www.omicsclass.com/article/1162
df=log2(df)
pdf(file=paste(opt$outdir,"/",opt$name,".pdf",sep=""), height=opt$height, width=opt$width)
pheatmap(df,color=color_map,border=FALSE,
scale="row",
show_colnames=TRUE,
show_rownames=opt$showrownames
)
dev.off()
png(filename=paste(opt$outdir,"/",opt$name,".png",sep=""), height=opt$height*300, width=opt$width*300, res=300, units="px")
pheatmap(df,color=color_map,border=FALSE,
scale="row",
show_rownames=opt$showrownames,
show_colnames=TRUE)
dev.off()