输入文件也有可能有问题,你对比下例子数据;命令行书写错误吧,
R脚本画相关性散点图时报错
使用课程中的R语言脚本画图时,提示报错如下
Error in `[.data.frame`(metadata, , opt$cor_name) : 选择了未定义的列
Calls: print ... scales_add_defaults -> lapply -> FUN -> [ -> [.data.frame
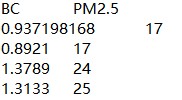
我的数据为两列污染数据,类似:
 已转为tsv格式
源代码如下:
#!/usr/bin/Rscript
#设置镜像
local({r<-getOption("repos")
r["CRAN"]<-"https://mirrors.tuna.tsinghua.edu.cn/CRAN/"
options(repos = r)})
#安装bioconductor常用包
options(BioC_mirror = "https://mirrors.tuna.tsinghua.edu.cn/bioconductor")
p="argparse"
if(!suppressWarnings(suppressMessages(require(p,character.only = TRUE,quietly = TRUE,warn.conflicts = FALSE)))){
install.packages(p,warn.conflicts = FALSE)
suppressWarnings(suppressMessages(library(p,character.only = TRUE,quietly = TRUE,warn.conflicts = FALSE)))
}
test5<-ArgumentParser(description = "Correlation scatter plot")
test5$add_argument("-m","--meta",type = "character",required = T,
help = "Input contains two columns of data for calculating the correlation[required]",metavar = "meta")
test5$add_argument("-n","--name",type = "character",default = "IRPS",
help = "Specifies the column name of the column[optional,default:IRPS]",metavar = "name")
test5$add_argument("-c","--cor_name",type = "character",default = "PDCD1",
help = "The column name that computes correlation with the specified column[optional,default:PDCD1]",metavar = "cor_name")
test5$add_argument("--log2",action = 'store_true',
help = "Whether to perform log2 processing[optional,default:False]")
test5$add_argument("-t","--method",type = "character",default = "pearson",
help = "Specifies the method to calculate the correlation[optional:pearson/Spearman/...,default:pearson]",metavar = "method")
test5$add_argument("-l","--color",type = "character",default = "black",
help = "Specifies the color of the fitting curve[optional,default:black]",metavar = "color")
test5$add_argument("-s","--size",type = "double",default = 0.5,
help = "Specify the thickness of the fitting curve[optional,default:0.5]",metavar = "size")
test5$add_argument("-H","--height",type = "double",default = 8,
help = "the height of dumbbell plot[optional,default 8]")
test5$add_argument("-W","--width",type = "double",default = 8,
help = "the width of dumbbell plot[optional,default 8]")
test5$add_argument("-o","--outdir",type = "character",default = getwd(),
help = "output file directory[optional,default cwd]")
test5$add_argument("-p","--prefix",type = "character",default = "kegg",
help = "out file name prefix[optional,default kegg]")
opt<-test5$parse_args()
if( !file.exists(opt$outdir) ){
if( !dir.create(opt$outdir,showWarnings = FALSE,recursive = TRUE)){
stop(paste("dir.create failed: outdir=",opt$outdir,sep = ""))
}
}
#包的加载
package_list<-c("ggplot2","RColorBrewer","ggpubr")
#判断R包加载是否成功如果加载不成功自动安装
for(p in package_list){
if(!suppressWarnings(suppressMessages(require(p,character.only = TRUE,quietly = TRUE,warn.conflicts = FALSE)))){
install.packages(p,warn.conflicts = FALSE)
suppressWarnings(suppressMessages(library(p,character.only = TRUE,quietly = TRUE,warn.conflicts = FALSE)))
}
}
metadata<-read.table(opt$meta,header = T,sep = "\t",check.names = F)
x<-sample(1:7,1,replace = T)
p<-ggplot(data = metadata,aes(x = metadata[,opt$cor_name],y = metadata[,opt$name]))+
geom_point(color = brewer.pal(7,"Set2")[x])+
stat_smooth(method = "lm",se = F,color = opt$color,size = opt$size)+
stat_cor(data = metadata,method = opt$method)+
xlab(opt$cor_name)+ylab(opt$name)
pdf(file = paste(opt$outdir,"/",opt$prefix,"_cor_scatter_plot.pdf",sep = ""),height = opt$height,width = opt$width)
print(p)
dev.off()
png(filename = paste(opt$outdir,"/",opt$prefix,"_cor_scatter_plot.png",sep=""),height = opt$height*300,width = opt$width*300,res = 300,units = "px")
print(p)
dev.off()
1 个回答
- 1 关注
- 0 收藏,1682 浏览
- Oriental White Birch 提出于 2023-01-02 16:37
