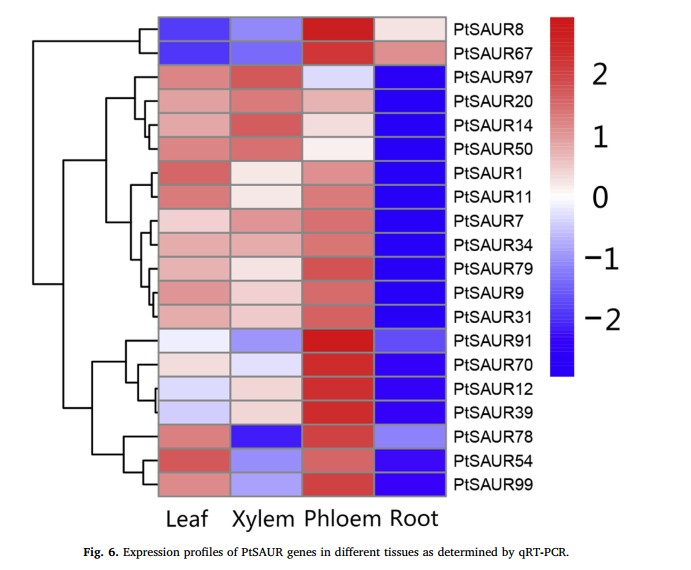
如何用荧光定量数据绘制热图?
 这是看到的一篇文献中Fig. 6. Expression profiles of PtSAUR genes in different tissues as determined by qRT-PCR.
There were three biological and three technical
replicates performed for each sample. The relative expression levels
were evaluated by 2-ΔΔCT. GraphPad software was used for the statistical analyses.
作者是用的2-ΔΔCT的方法做的数据分析,可是结果怎么会是负数呢?
在问答社区内看到 莫非他是用的-ΔΔCT?恳请老师们解答,谢谢了
请先 登录 后评论
最佳答案 2019-10-29 15:36
为了是热图每一行对比明细,使热图很好看,热图一般按行均一化数据。所以,legend会有负数。聚类热图绘制见:https://www.omicsclass.com/article/528
qpcr的计算方法见:https://www.omicsclass.com/article/446
请先 登录 后评论
如果觉得我的回答对您有用,请随意打赏。你的支持将鼓励我继续创作!

- 1 关注
- 0 收藏,11218 浏览
- 。翟 提出于 2019-10-28 17:33